Before you configure a single field in an ERP system, you need to know exactly how your business operates, step by step, decision by decision. That’s where business process mapping comes in. It’s the practice of creating visual diagrams that document how work actually flows through your organization, from the first trigger to the final outcome. Without it, you’re building on assumptions. And assumptions are expensive.
For CFOs and finance leaders at midsized companies, process mapping isn’t just an operational exercise, it’s a financial one. Every undocumented workaround, every bottleneck hiding in your order-to-cash cycle, every manual handoff between departments represents money left on the table. Mapping these processes gives you the visibility to fix them and the foundation to automate them inside platforms like NetSuite or Acumatica.
At Concentrus, we’ve seen firsthand what happens when companies skip this step. ERP implementations stall, teams resist adoption, and the ROI never materializes. That’s why process mapping is built into our ROI Roadmap™ methodology, it ensures every system decision ties back to measurable financial outcomes, not guesswork.
This guide breaks down what business process mapping is, why it matters, the standard symbols used to build these diagrams, and a step-by-step approach to creating your own. We’ll also walk through real examples so you can see the concept in action and apply it to your own operations.
What business process mapping is and what it is not
When people ask what is business process mapping, they usually expect a software answer. The reality is more foundational than that. Business process mapping is the discipline of creating visual diagrams that show how work moves through your organization, step by step, from a starting event to a defined outcome. These diagrams capture who does what, in what order, under what conditions, and where decisions branch. The output is a shared picture of reality, not the way leadership assumes things work, but the way they actually work on the ground.
A process map doesn’t describe the ideal version of your workflow. It describes the current one, so you know exactly what you’re dealing with before you change anything.
What a process map captures
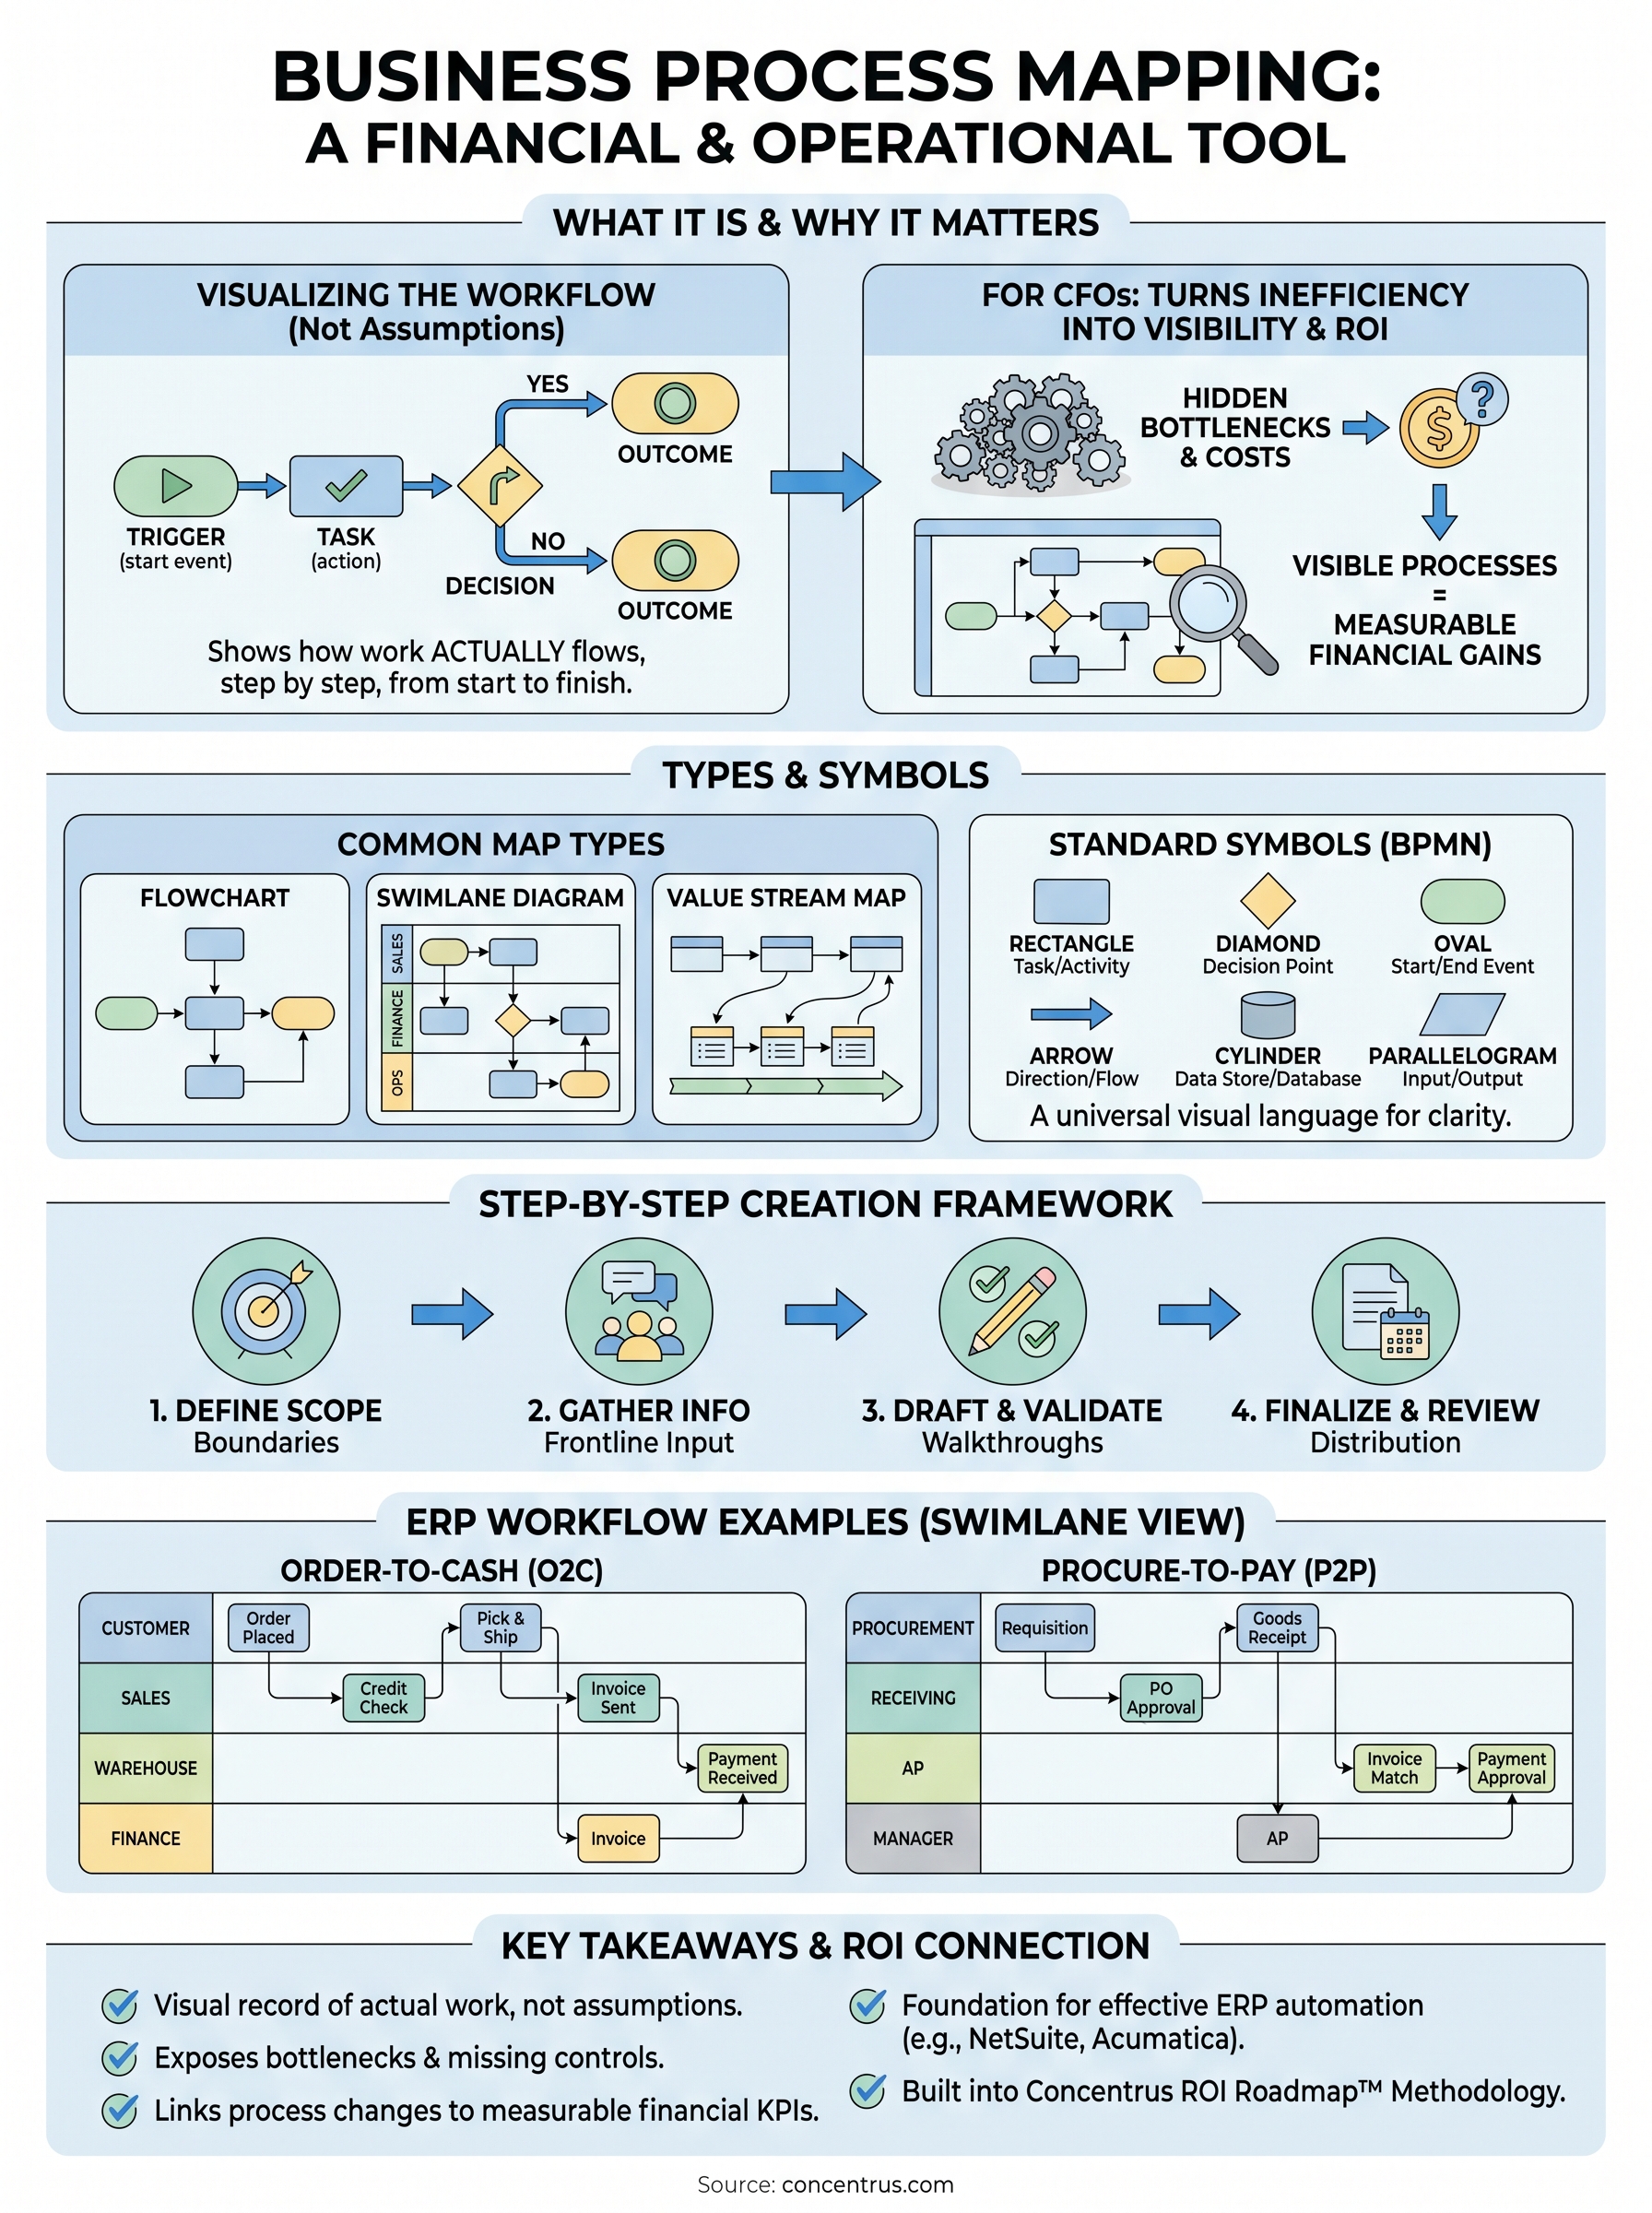
A process map shows the full sequence of tasks, decisions, and handoffs that make up a single business workflow. That could be your accounts payable cycle, your customer onboarding sequence, or your inventory replenishment flow. Each element in the diagram carries a specific meaning: rectangles represent tasks, diamonds represent decision points, and arrows show direction. The result is a visual language that any stakeholder across finance, operations, or IT can read and interpret without ambiguity.
These maps also capture the roles responsible for each step, often organized into horizontal bands called swimlanes. This structure makes it immediately clear which team or individual owns each part of the process. When something breaks down, you know exactly where to look. When you want to automate a step inside an ERP, you know exactly what conditions and inputs that automation needs to handle correctly.
What process mapping is not
Process mapping is not the same as writing a procedures manual. A procedures manual tells someone how to perform a task in text form. A process map shows how that task connects to everything before and after it in a visual flow. The distinction matters because text documentation hides dependencies, while a process map surfaces them immediately so you can act on what you find.
Treating process mapping as a one-time audit activity is another mistake to avoid. Some organizations produce a map during an ERP implementation and then file it away. Your maps should be living documents that you update whenever a workflow changes. A map from three years ago reflects a business that no longer exists. Relying on it during a system change introduces risk, not confidence.
The boundary between mapping and process improvement
Mapping and improving are two separate activities, and confusing them is one of the most common mistakes organizations make. Process mapping documents what is. Process improvement redesigns what should be. You need to complete the mapping step first, because you cannot fix a process you don’t fully understand and haven’t clearly seen.
This boundary matters most during ERP implementations. Teams that skip mapping and jump straight to configuration end up building a system that replicates existing inefficiencies in software form. The bottlenecks don’t disappear; they get embedded in approval workflows, automation rules, and system settings. Mapping first gives you the window to identify and remove those inefficiencies before they get locked into the platform and become far more expensive to untangle.
Why business process mapping matters to CFOs
For CFOs, every operational inefficiency has a dollar amount attached to it, even if no one has calculated it yet. Understanding what is business process mapping means recognizing that this discipline is not just an IT or operations concern. It is a financial visibility tool. When you can see exactly how work flows through your organization, you can start quantifying where that work breaks down, stalls, or costs more than it should.
Process maps reveal the true cost of broken workflows
Manual handoffs, redundant approvals, and undocumented exceptions rarely show up on a balance sheet. But they consume hours, create errors, and slow down your financial close. A process map pulls these inefficiencies out of the shadows and shows them as specific steps in a documented flow. Once they are visible, you can assign cost estimates to each bottleneck and build a clear business case for fixing them.
When you can see a broken step in a diagram, it stops being an abstract complaint and becomes a specific problem with a specific owner and a measurable fix.
Most finance leaders are surprised by what mapping surfaces. Processes that felt smooth from a management perspective often reveal three or four unnecessary steps at the execution level, steps that slow down invoicing, delay reporting, or introduce reconciliation errors that take hours to untangle.
Mapping gives you the foundation for ERP ROI
An ERP system can only automate what you fully understand. If you configure NetSuite or Acumatica against a workflow no one has documented clearly, you end up encoding your current inefficiencies into software. The system runs, but the problems stay embedded. Process mapping gives you a clean, verified workflow to hand to your implementation team, so the system gets built around how your business should operate, not just how it currently does.
For Concentrus clients, this is where the ROI Roadmap™ methodology pays off directly. When every process map ties back to a financial KPI, such as days sales outstanding, close cycle time, or inventory turnover, you can measure whether the ERP is actually moving those numbers. That accountability is what transforms an ERP project from a sunk cost into a return-generating investment your leadership team can defend with real data.
Process map types and when to use each one
Not every process gets the same map. When you understand what is business process mapping in practice, you quickly realize that different workflows call for different diagram formats. Choosing the wrong type creates confusion rather than clarity, and that confusion costs you time when you need fast decisions about system design or process improvement.
Flowcharts and swimlane diagrams
A basic flowchart is the most common starting point. It maps a single process in a linear sequence, showing tasks, decisions, and endpoints in a straightforward top-to-bottom or left-to-right flow. Use a flowchart when you need to document a contained, single-owner process like generating a purchase order or closing a period-end journal entry. Flowcharts are fast to build and easy to share across teams, even those without technical backgrounds.
Swimlane diagrams add a layer of accountability by organizing the same flow into horizontal or vertical bands, one for each department, role, or team involved. Each step sits inside the lane of whoever owns it. This format immediately surfaces handoff points between departments, which is exactly where most breakdowns occur. If you are mapping an accounts receivable cycle that crosses finance, sales, and operations, a swimlane diagram shows you where the ball gets dropped and which team is holding it when it does.
The swimlane format is the most valuable tool you have for diagnosing cross-departmental process failures before they get embedded into an ERP configuration.
Value stream maps and SIPOC diagrams
Value stream mapping comes from lean manufacturing but applies directly to financial operations. It layers time data onto the process flow, showing how long each step takes and where work sits idle between handoffs. When your goal is to reduce cycle time or eliminate waste, value stream mapping gives you metrics attached to each stage, not just the sequence. Use it when you are working through an order-to-cash or procure-to-pay optimization where speed and throughput are your primary KPIs.
SIPOC diagrams take a higher-level view. The acronym stands for Suppliers, Inputs, Process, Outputs, and Customers. Rather than documenting every individual task, a SIPOC gives you the boundaries and key components of a process at a glance. Use this format when you are scoping a new ERP workflow for the first time or when leadership needs a quick orientation to how a business function operates before a deeper mapping session begins. It keeps early project conversations focused on what matters without drowning stakeholders in step-by-step detail before the full mapping work begins.
Process mapping symbols and how to read them
When someone digs into what is business process mapping, the symbols are what separate a diagram that communicates clearly from one that confuses everyone who looks at it. Business process notation follows a standardized visual language rooted in the Business Process Model and Notation (BPMN) standard maintained by the Object Management Group. Learning this language lets you read any process diagram, regardless of who drew it or what software tool they used to produce it.
Once your team reads symbols the same way, process reviews stop being a debate about interpretation and start being a conversation about improvement.
The core shapes and what each one means
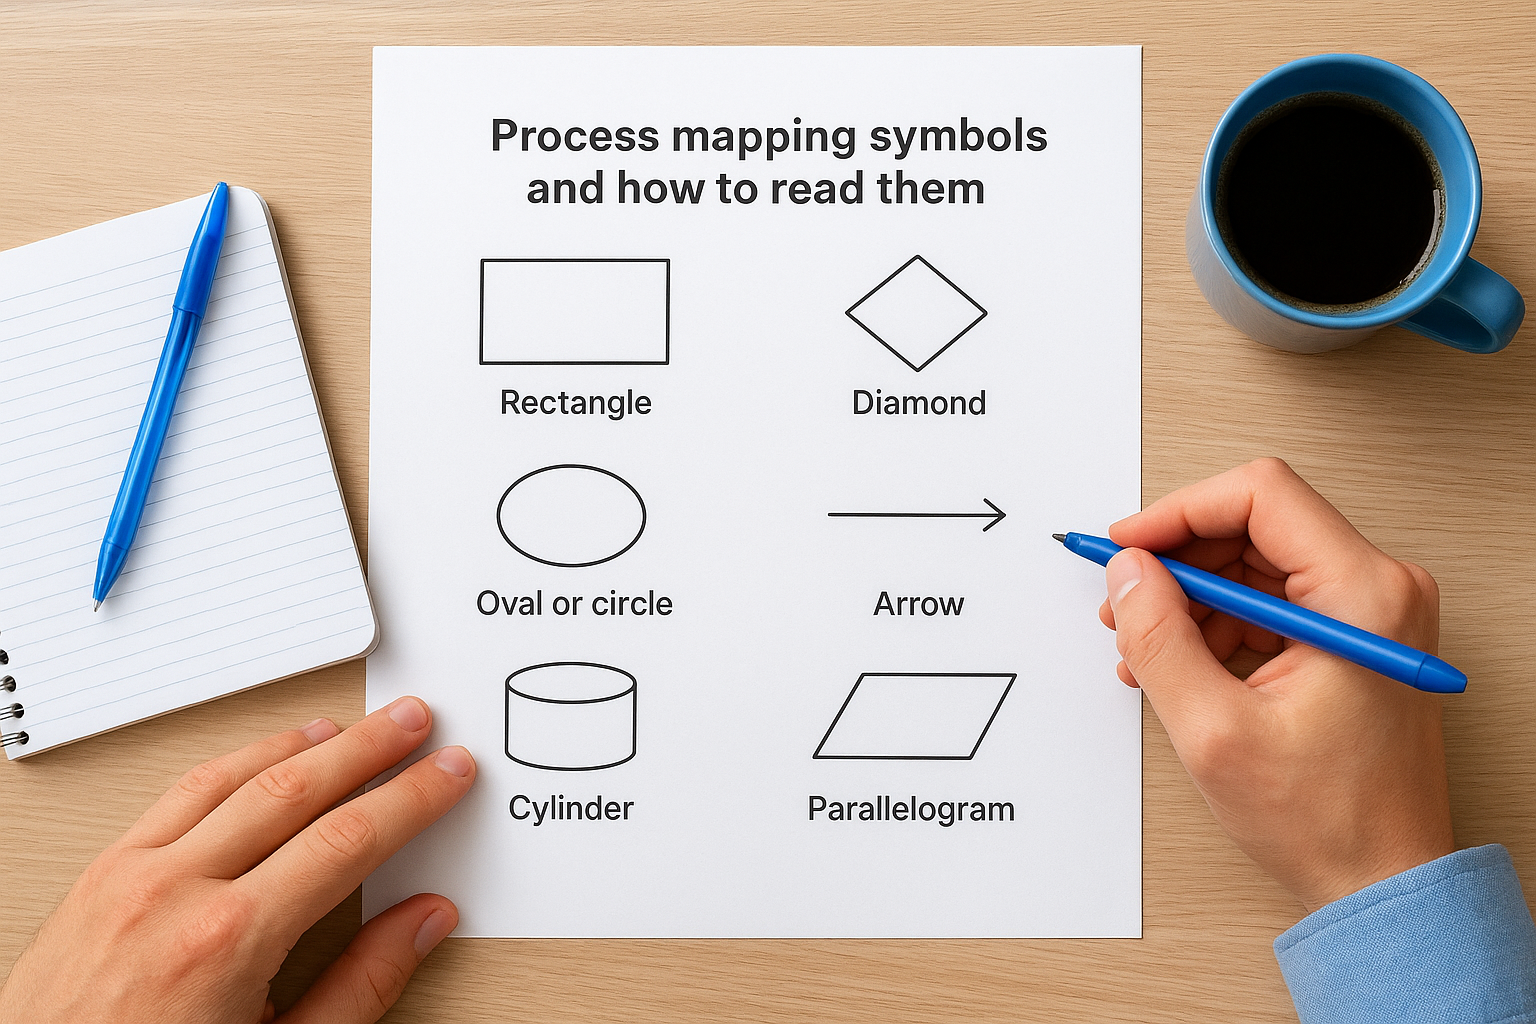
These shapes carry consistent meanings across industries and platforms, which is exactly why using them correctly matters from the start.
| Symbol | Shape | Meaning |
|---|---|---|
| Rectangle | Box | A task or activity that someone performs |
| Diamond | Rotated square | A decision point with two or more outcome paths |
| Oval or circle | Rounded shape | A start event or end event in the flow |
| Arrow | Directed line | The direction work travels between steps |
| Cylinder | 3D tube shape | A data store or database being referenced |
| Parallelogram | Slanted box | Data input or output at a specific step |
Tasks represented by rectangles form the backbone of every process map. Each rectangle should carry a clear verb-noun label, such as “Submit invoice” or “Approve purchase order,” so anyone reading the diagram knows exactly what action occurs at that point without needing to ask for clarification.
How connectors and annotations complete the picture
Arrows, also called sequence flows, tell you more than just direction. A solid arrow connects two steps in normal sequence, while a dashed arrow typically represents a message flow, showing communication between separate participants or systems rather than a direct handoff within one process. If you see a dashed line in a swimlane diagram, it signals that information is crossing an organizational boundary, not that work is moving within the same team or department.
Annotations add the context that symbols alone cannot carry. You can attach a text annotation to any shape to explain a business rule, a system trigger, or an exception condition that affects how that step executes. When you configure a workflow inside NetSuite or Acumatica, these annotations translate directly into logic rules, field validations, and approval conditions that your implementation team needs to build the system accurately. Leaving them out puts critical context outside both the diagram and the platform.
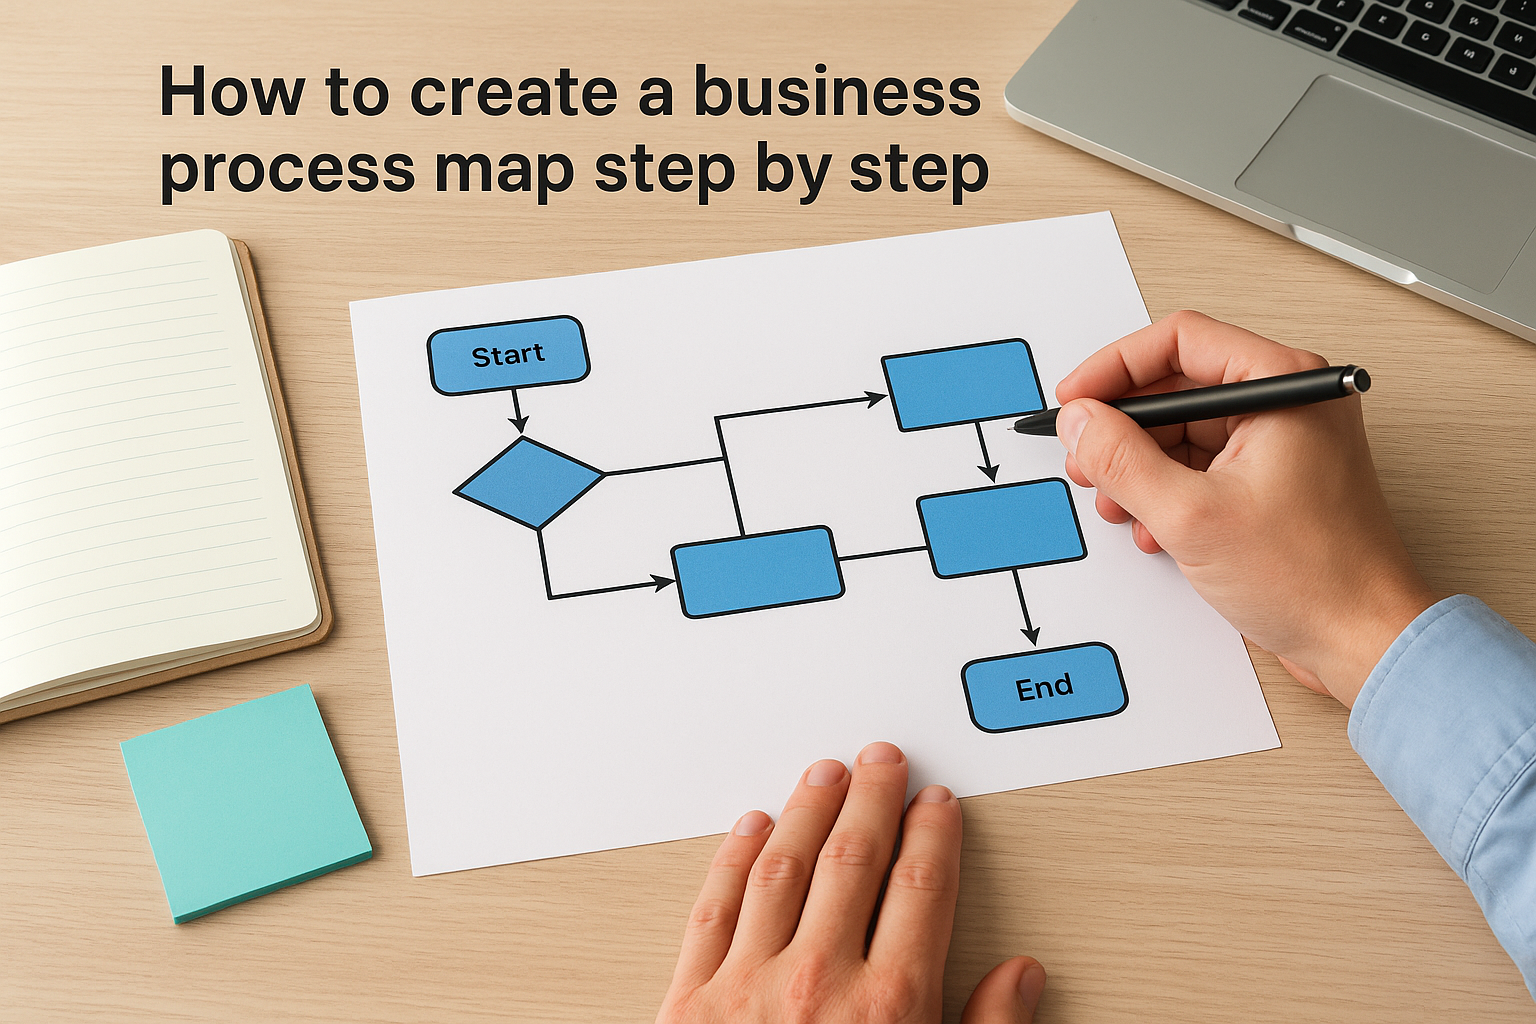
How to create a business process map step by step
Knowing what is business process mapping is only the first part. Building one that actually works requires a structured approach, because a poorly scoped or unvalidated map creates as many problems as having no map at all. The steps below give you a repeatable framework you can apply to any workflow, whether you are preparing for an ERP implementation, auditing an error-prone financial process, or scoping a new approval hierarchy inside NetSuite or Acumatica.
Step 1: Define the scope and boundaries
Before drawing a single shape, decide what triggers the process and where it ends. A clear scope statement keeps your mapping session focused and prevents the diagram from drifting into adjacent workflows mid-session. Answer these three questions before you open any diagramming tool:
- What event or condition starts this process?
- What outcome signals the process is fully complete?
- Which roles, departments, and systems fall inside or outside the scope?
Skipping this step is the single most common reason mapping sessions run long and produce diagrams that no one can act on afterward.
Step 2: Gather information from the people doing the work
Your map needs to reflect how work actually happens, not how leadership assumes it does. Schedule working sessions with the individuals who execute each step, not just the managers who oversee them. Ask participants to walk through the process in detail, including every exception, workaround, and conditional branch they handle regularly. These details rarely surface in existing documentation but represent your largest operational and financial risk points.
The people closest to the work always know more about how a process functions, and breaks down, than the people who originally designed it.
Step 3: Draft the sequence and validate it
Use your gathered inputs to build an initial draft using standard BPMN symbols and place each step inside the correct swimlane. Once a draft exists, bring it back to the same frontline contributors for a walkthrough. Ask them to flag any step that does not match their real experience. This validation session catches missing steps, incorrect decision branches, and sequencing errors before the map reaches your implementation or process improvement team.
Skipping validation is where most mapping efforts break down. One validation session prevents weeks of rework after a misconfigured ERP workflow goes live and starts generating exceptions your team has to untangle manually.
Step 4: Finalize, distribute, and schedule reviews
A completed map only delivers value if the right people can access and use it. Store it in a shared location your finance leadership, operations team, and ERP implementation partners can reference throughout the project. Set a review cadence tied to major workflow changes or at minimum annually, so the map stays current as your business evolves and your systems change alongside it.
Business process mapping examples for ERP workflows
Understanding what is business process mapping becomes far more concrete when you see it applied to the workflows inside an ERP platform. Abstract diagrams make sense once you connect them to real financial cycles your team runs every day. The two most common ERP workflows that benefit from detailed mapping are the order-to-cash cycle and the procure-to-pay cycle, both of which touch cash flow directly and create measurable risk when they contain undocumented exceptions.
Order-to-cash process map
The order-to-cash cycle starts when a customer places an order and ends when you collect and record the payment. In a swimlane map, the flow typically crosses sales, warehouse, finance, and the customer across four separate lanes. Each department owns specific steps: sales confirms the order and validates credit, the warehouse picks and ships, finance generates and sends the invoice, and the customer triggers payment that finance then applies and reconciles.
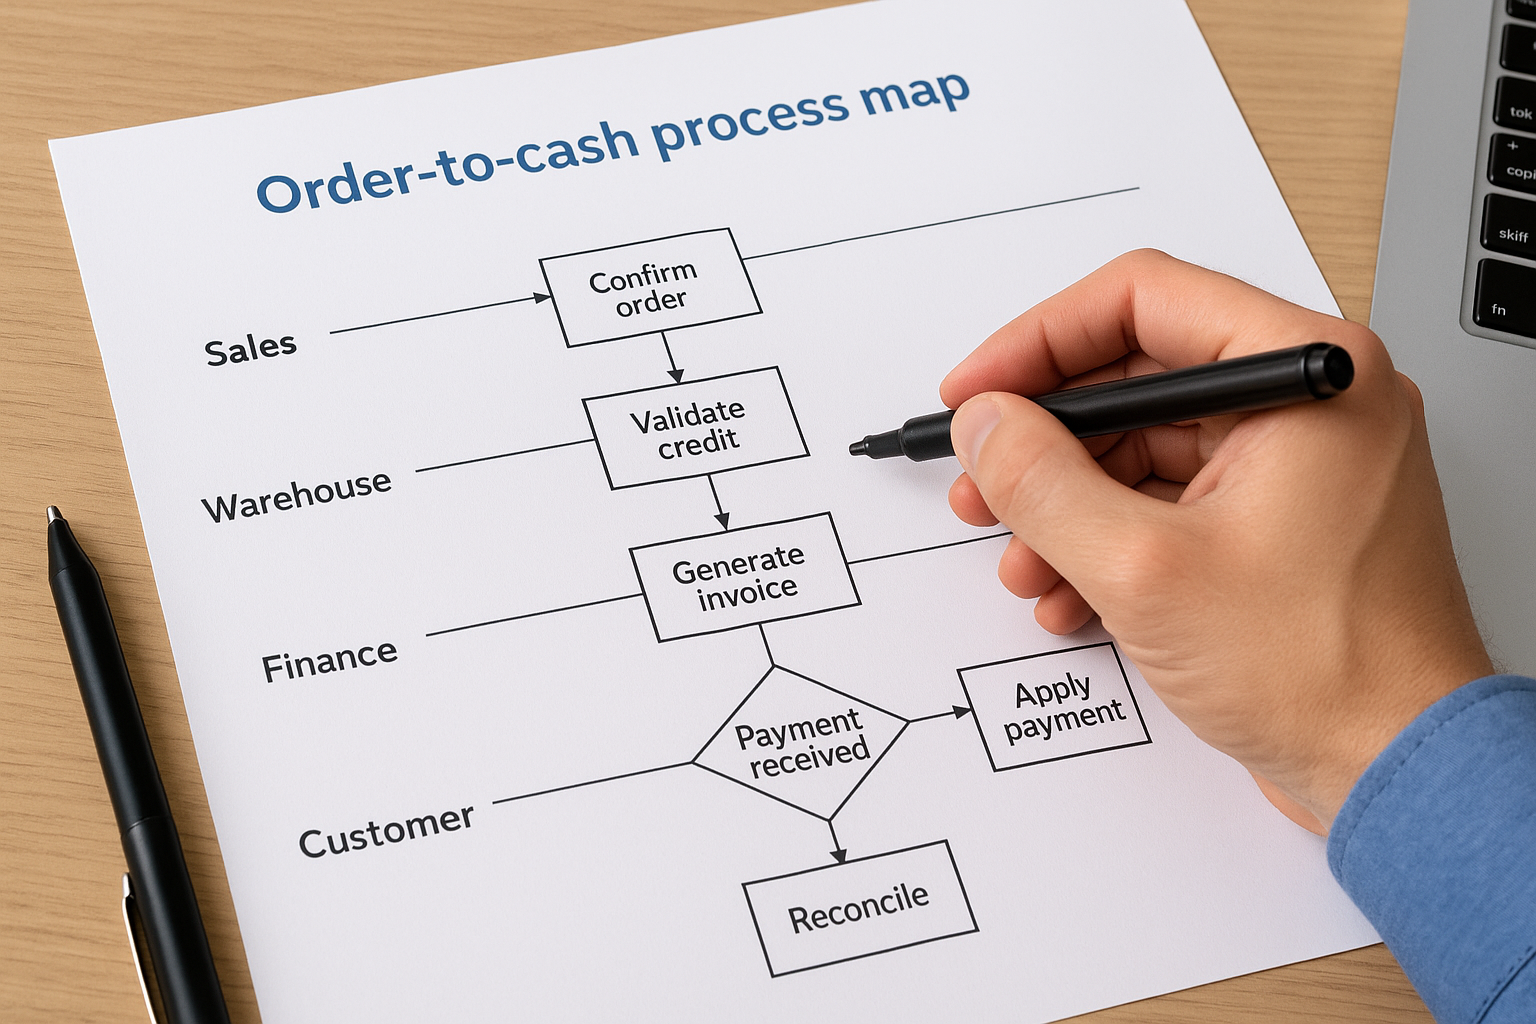
When you map this flow inside NetSuite, the diagram immediately reveals where manual steps slow down cash collection. A common finding is that invoice generation requires a manual trigger rather than firing automatically when a shipment is confirmed. Mapping that gap lets you configure an automation rule that reduces your average days sales outstanding without requiring any change to how your team works day to day.
Mapping the order-to-cash cycle before configuring NetSuite often surfaces three to five manual steps that disappear entirely once the system is built against a clean, validated workflow.
Procure-to-pay process map
The procure-to-pay cycle begins with a purchase requisition and ends when a supplier invoice is matched, approved, and paid. A swimlane map for this workflow typically spans procurement, receiving, accounts payable, and the approving manager, with decision diamonds at the approval threshold and at the three-way match between the purchase order, receipt, and invoice.
Mapping this workflow inside Acumatica shows exactly which approval conditions the system needs to enforce automatically versus which ones require human review. You can also see where invoice exceptions pile up because a receiving confirmation is missing or delayed. Building your system configuration against a validated process map means those exceptions get flagged in real time rather than discovered during a reconciliation two weeks later, which directly reduces the hours your AP team spends chasing discrepancies and protects your cash position throughout the month.
How to use maps to improve controls and ROI
Once you understand what is business process mapping and have documented your key workflows, the real work begins. Process maps are not just documentation artifacts, they are active tools for strengthening your internal controls and proving that every dollar invested in your ERP is generating a return. The connection between your maps and your financial outcomes becomes explicit when you build that link deliberately into how your organization uses and maintains those diagrams over time.
Identifying control gaps before auditors do
A process map shows you every point where a control should exist but currently does not. Approval thresholds without documented authorization, payment steps that bypass a matching requirement, and data entry points with no validation rule all appear clearly in a well-built diagram. When you review your maps against your internal control framework, you can flag those gaps before they become audit findings or, worse, the source of a financial loss your team has to explain after the fact.
Auditors follow the same logic a process map uses: they trace a transaction from origin to outcome and look for the places where controls are missing or bypassed.
This review process is especially powerful before an ERP go-live. You can compare your current-state map against your future-state design and confirm that every control requirement transfers correctly into the system configuration. If a three-way match rule exists in your current workflow, you can verify it is built into Acumatica or NetSuite before the system goes live, rather than discovering the gap after your first reconciliation failure has already created downstream problems for your AP team and your reporting cycle.
Tying map improvements to financial KPIs
Each bottleneck or missing control you remove from a process map should connect directly to a measurable financial outcome. If you eliminate a manual approval step in your order-to-cash cycle, track whether your days sales outstanding decreases in the following quarter. If you close a duplicate payment risk in your procure-to-pay flow, measure the reduction in exception volume and the hours your AP team recovers as a result. These connections turn your maps from static diagrams into a live performance management tool that finance leadership can use to justify continued investment in process and system improvements.
Linking every process change to a specific KPI is what separates an ERP project that delivers results from one that simply goes live. At Concentrus, this is the core of how the ROI Roadmap™ methodology works: every map improvement feeds a measurable outcome, and every measurable outcome builds the case for continued investment in your systems and your team’s long-term capacity to operate them with confidence and precision.
Key takeaways
Business process mapping gives you a clear, visual record of how work actually moves through your organization, from trigger to outcome. When you understand what is business process mapping and apply it before any ERP configuration begins, you protect your investment by building your system against verified workflows rather than assumptions.
The core benefits are practical: maps expose bottlenecks, surface missing controls, and connect every process change to a measurable financial outcome. Swimlane diagrams, value stream maps, and SIPOC frameworks each serve a specific purpose depending on how much detail and cross-functional visibility you need. Keeping your maps current as your business evolves means they stay useful long after your ERP goes live.
If you want an ERP implementation that ties directly to measurable ROI, connect with the Concentrus team to learn how the ROI Roadmap™ methodology puts process mapping at the center of every project from day one.