
CFOs don’t need another dashboard that looks impressive in a demo but collects dust after launch. What they need is KPI dashboard software that connects directly to the financial and operational metrics driving real decisions, margin performance, cash flow trends, close times, and supply chain efficiency. The gap between "we have data" and "we act on data" is exactly where the right tool makes its impact.
But choosing that tool gets complicated fast, especially when your KPI dashboards need to pull from an ERP system like NetSuite or Acumatica. At Concentrus, we build ERP implementations around our ROI Roadmap™ methodology, which means measurable KPIs aren’t an afterthought, they’re the foundation. That perspective gives us a sharp lens on what actually matters in dashboard software for finance leaders at midsized companies.
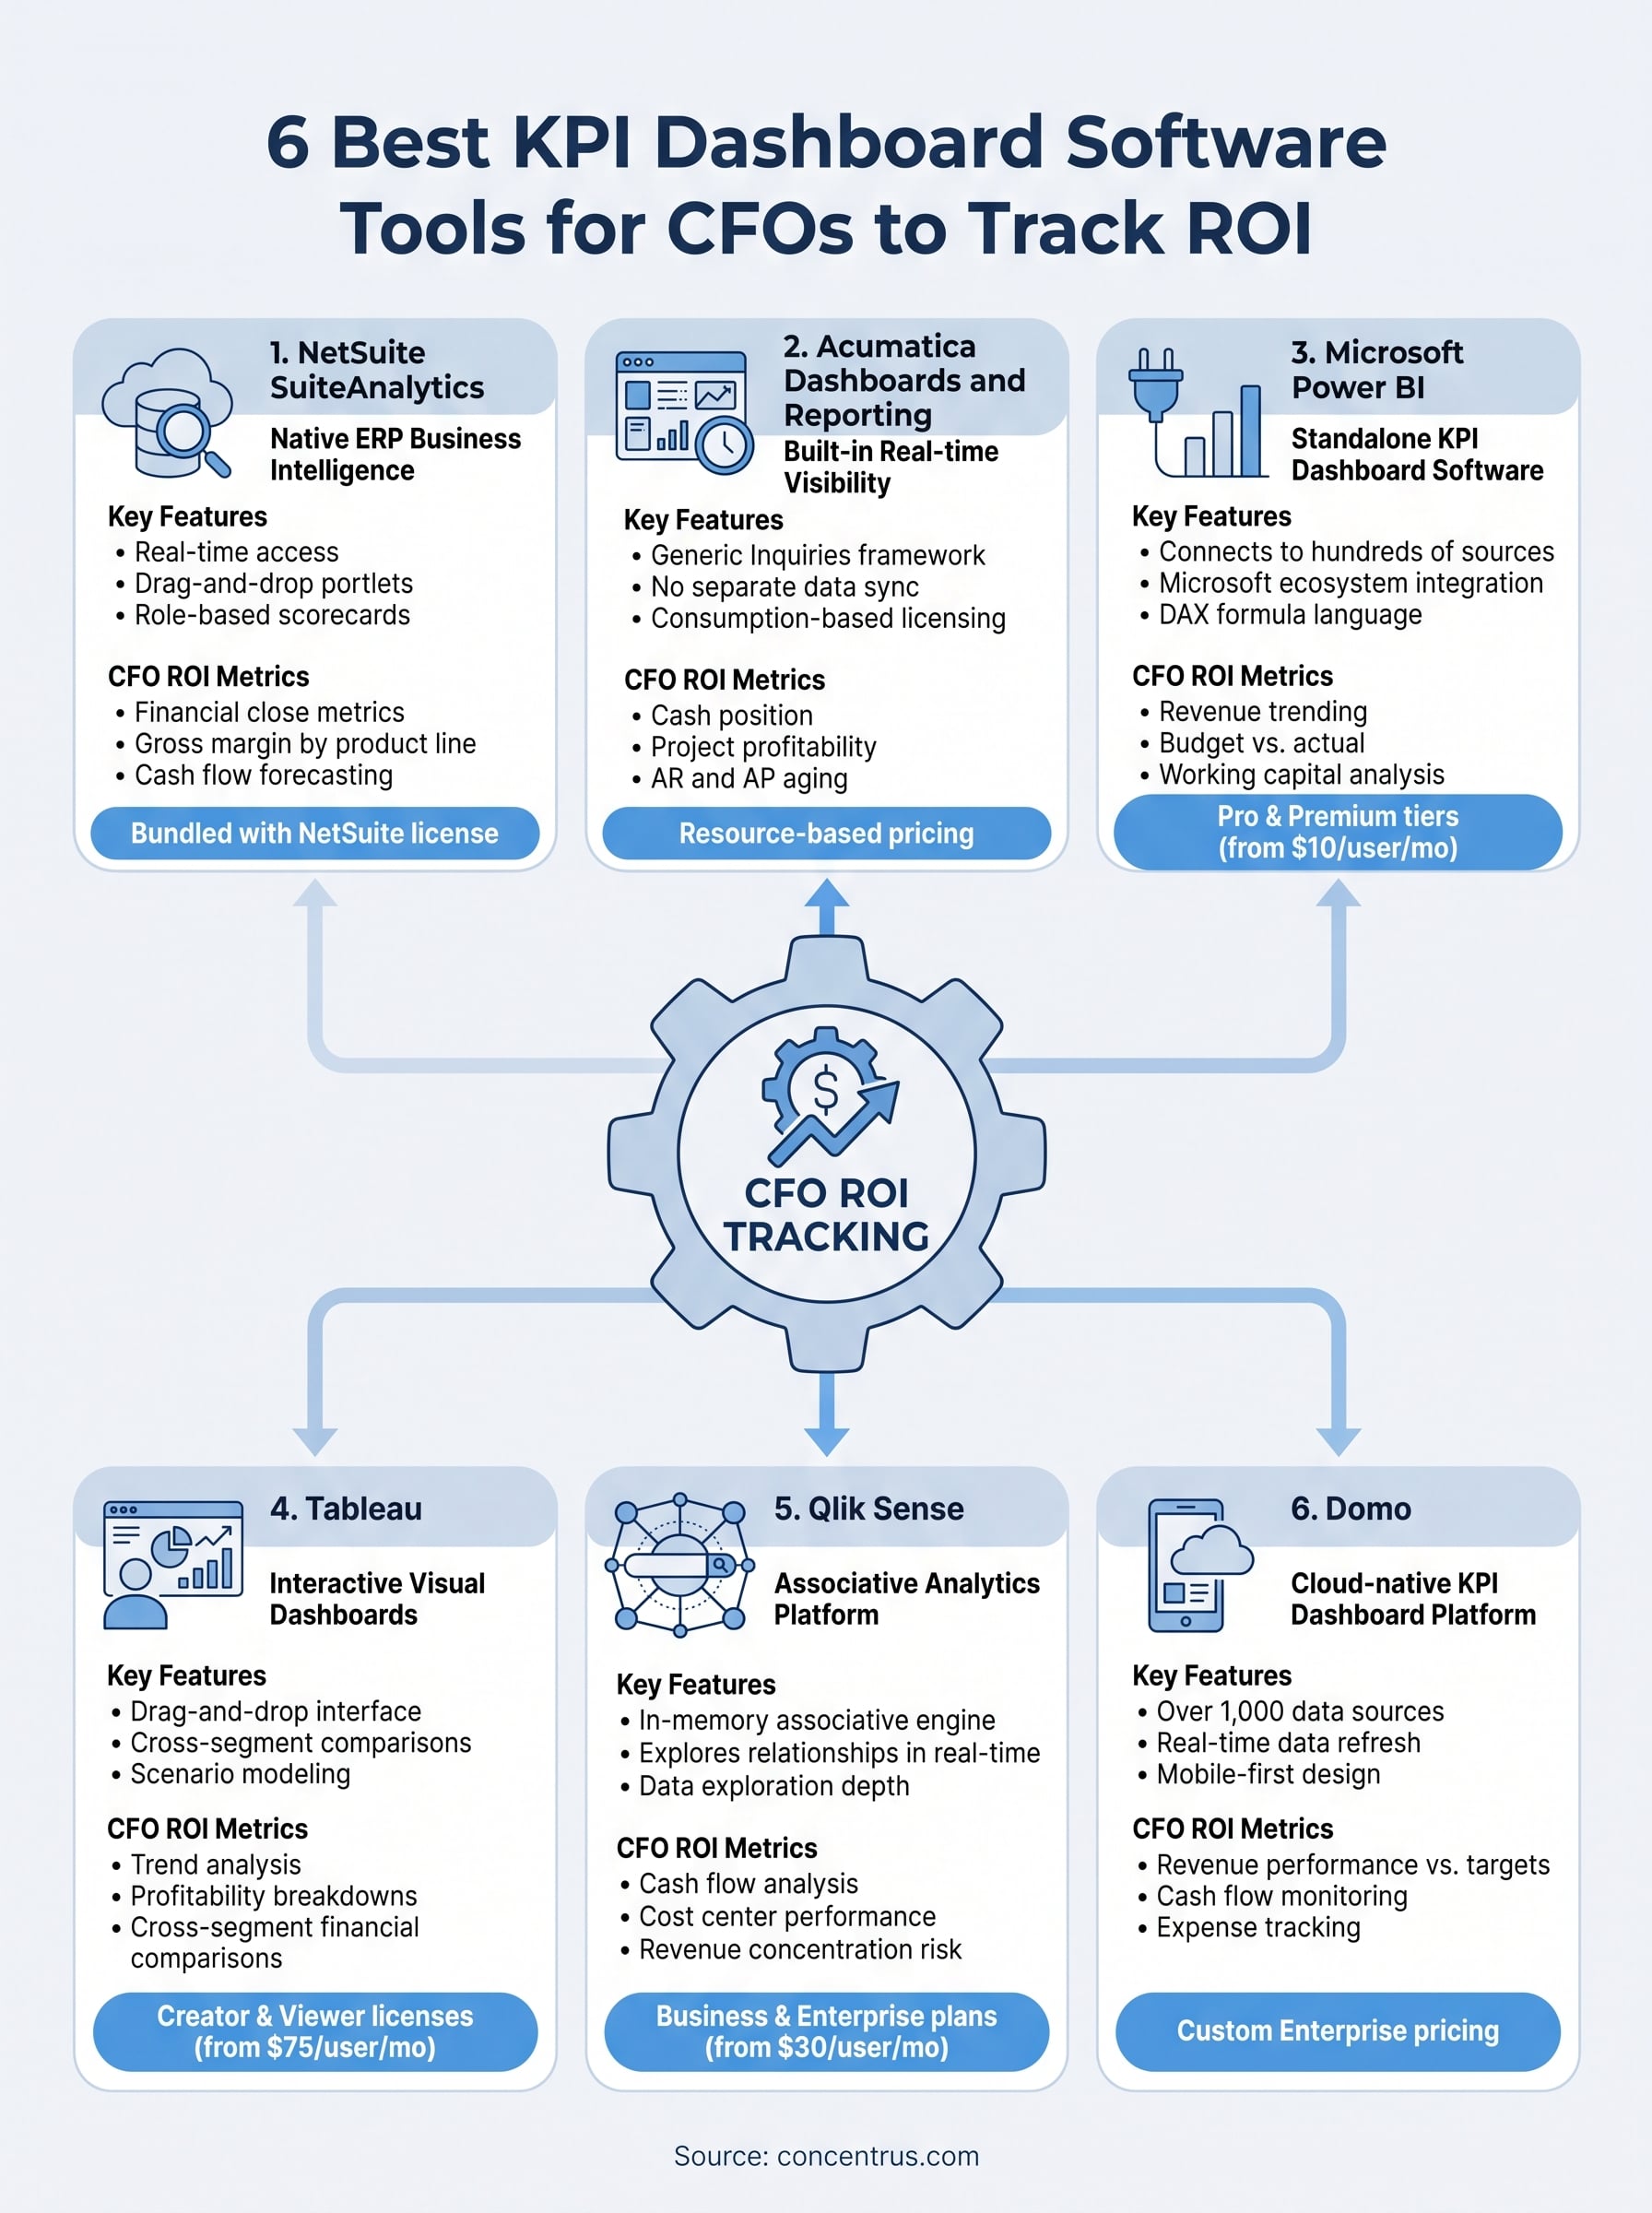
This article breaks down six KPI dashboard tools worth evaluating, with a focus on features that matter to CFOs: real-time financial visibility, ERP integration depth, and the ability to track ROI milestones without relying on a data analyst to pull every report. Whether you’re selecting your first dashboard or replacing one that never delivered on its promise, this list will help you narrow the field.
1. NetSuite SuiteAnalytics
NetSuite SuiteAnalytics is the native business intelligence layer built directly into the NetSuite ERP platform. If your company already runs on NetSuite, this is your first and strongest option for building a KPI dashboard that pulls live financial data without relying on a third-party connector.
What it is and how it works
SuiteAnalytics gives you real-time access to your NetSuite data through saved searches, reports, and configurable dashboards called KPI Scorecards. You build dashboards using drag-and-drop portlets that pull directly from the ERP’s live dataset, meaning every number reflects the same data your accounting team is working with at that moment. You can also create role-based dashboards so your controller sees different KPIs than your operations manager, all from the same underlying data source.
CFO ROI metrics it tracks well
At the CFO level, SuiteAnalytics handles financial close metrics, accounts receivable aging, gross margin by product line, and cash flow forecasting with solid depth. Because the data lives inside the ERP, you can drill from a high-level KPI down to the individual transaction that generated it, which is exactly what you need when explaining variance to the board.
This drill-down capability is what separates native ERP dashboards from standalone KPI dashboard software: no exports, no data lag, no reconciliation.
Strengths and trade-offs in practice
The biggest strength is zero data latency. Your dashboard reflects the current state of the ledger, not a snapshot from last night’s sync. The trade-off is that SuiteAnalytics has a steep learning curve for non-technical users. Building advanced saved searches requires familiarity with NetSuite’s data model, and some CFOs find they need administrator support to configure complex reports.
Pricing and licensing basics
NetSuite does not publish standard pricing publicly. Your SuiteAnalytics access is bundled with your NetSuite license, but advanced reporting modules and additional user seats carry added cost. Expect pricing to come up as part of your overall NetSuite subscription negotiation with either NetSuite directly or a certified partner.
2. Acumatica Dashboards and Reporting
Acumatica’s built-in dashboards give you real-time visibility into your business without requiring a separate BI platform. If your company runs on Acumatica, this native reporting layer is worth understanding before you invest in additional kpi dashboard software.
What it is and how it works
Acumatica delivers role-based dashboards through its Generic Inquiries framework, which lets you query live ERP data and surface it in configurable widgets, charts, and scorecards. You build dashboards directly inside the platform, pulling from the same dataset your finance and operations teams use daily, so there is no separate data sync required.
CFO ROI metrics it tracks well
Acumatica tracks cash position, project profitability, AR and AP aging, and inventory turnover with solid native depth. Its project accounting module is particularly strong, making it a good fit for service and construction companies that need margin tracking at the project level.
If your business bills by project or contract, Acumatica’s project-level KPI tracking gives you margin visibility that most standalone tools require significant setup to replicate.
Strengths and trade-offs in practice
The platform’s consumption-based licensing means unlimited users can access dashboards without per-seat cost penalties, which is a real advantage for broader finance team visibility. The trade-off is that advanced visualizations require third-party integrations with tools like Power BI.
Pricing and licensing basics
Acumatica uses resource-based pricing tied to transaction volumes rather than user count. Exact costs depend on your modules and consumption tier, so contact an Acumatica partner for a scoped estimate.
3. Microsoft Power BI
Microsoft Power BI is a standalone kpi dashboard software platform that connects to hundreds of data sources, including NetSuite and Acumatica, through pre-built or custom connectors. It sits inside the Microsoft ecosystem that most midsized finance teams already use daily, which lowers the adoption barrier significantly.
What it is and how it works
Power BI pulls data from your ERP, CRM, spreadsheets, and databases into a centralized model, then lets you build interactive dashboards with drag-and-drop simplicity. You publish those reports to the Power BI Service so your finance team can access live views from any browser or the mobile app without needing a local installation.
CFO ROI metrics it tracks well
Power BI handles revenue trending, budget vs. actual comparisons, and working capital analysis well, especially when your financial data lives across multiple systems. Its DAX formula language lets you build custom calculated KPIs that match your exact business logic rather than forcing you into predefined metric templates.
The ability to blend ERP data alongside CRM and operational sources in one dashboard is where Power BI consistently outperforms most native ERP reporting tools.
Strengths and trade-offs in practice
The visualization library and community template ecosystem are genuinely hard to match. The trade-off is that meaningful dashboards require someone with data modeling skills to build the underlying structure correctly, which adds real implementation time before you see value.
Pricing and licensing basics
Power BI Pro runs $10 per user per month, and Power BI Premium starts at $20 per user per month for larger data capacities and advanced AI features.
4. Tableau
Tableau is one of the most recognized names in kpi dashboard software, and for good reason. It turns complex datasets into interactive visual dashboards that finance teams can explore without writing a single line of code.
What it is and how it works
The platform connects to your ERP, database, or spreadsheet data and lets you build visualizations through a drag-and-drop interface. You publish finished dashboards to Tableau Server or Tableau Cloud so your finance team accesses live views from any browser without a local installation.
CFO ROI metrics it tracks well
Tableau excels at trend analysis, profitability breakdowns, and scenario modeling across large datasets. If your KPI tracking spans multiple business units or subsidiaries, Tableau handles cross-segment financial comparisons better than most native ERP reporting tools.
When your data lives in multiple systems, Tableau’s ability to blend and visualize it in one place saves hours of manual consolidation each month.
Strengths and trade-offs in practice
The visualization depth and flexibility are Tableau’s clearest advantage over most native ERP reporting layers. Building reliable dashboards requires a skilled analyst who understands data structure and Tableau’s calculation logic, which adds real setup cost before your finance team sees value.
Pricing and licensing basics
Tableau Creator licenses start at $75 per user per month, with Viewer licenses at $15 per user per month for teams that need read-only dashboard access.
5. Qlik Sense
Qlik Sense is an associative analytics platform that takes a different approach to kpi dashboard software than most competitors. Instead of querying data along a fixed path, Qlik’s associative engine lets you explore relationships across your entire dataset in real time, surfacing connections that standard filtered reports miss entirely.
What it is and how it works
Qlik Sense connects to your ERP, databases, and cloud sources through native connectors, then loads that data into an in-memory associative engine. You build dashboards through a drag-and-drop interface, and every click on a data point filters the entire dashboard simultaneously, exposing patterns that linear query tools simply cannot replicate.
CFO ROI metrics it tracks well
The platform handles cash flow analysis, cost center performance, and revenue concentration risk well. Its strength shows when your KPIs depend on uncovering non-obvious relationships between financial variables, such as which customer segments drive your highest margin volatility quarter over quarter.
Qlik’s associative model is genuinely useful when you suspect your data holds patterns that your standard ERP reports are not surfacing.
Strengths and trade-offs in practice
Qlik’s exploration depth sets it apart from simpler dashboard tools. The trade-off is that data governance and preparation require dedicated IT or analyst support to implement correctly, adding real time before your finance team sees consistent value.
Pricing and licensing basics
Qlik Sense Business starts at $30 per user per month, with Enterprise pricing available through direct negotiation with Qlik or a certified partner.
6. Domo
Domo is a cloud-native kpi dashboard software platform built to consolidate your entire business data landscape into one accessible environment. It targets finance leaders who need real-time visibility across financial, operational, and external data sources without managing on-premise infrastructure.
What it is and how it works
Domo connects to over 1,000 data sources through pre-built connectors, pulling data from your ERP, CRM, and databases into a centralized cloud layer. You build dashboards through a drag-and-drop interface and share them across your leadership team through any browser or Domo’s mobile app.
CFO ROI metrics it tracks well
Domo surfaces several KPIs that CFOs depend on for day-to-day financial oversight:
- Revenue performance vs. budget targets
- Cash flow monitoring across multiple entities
- Expense tracking by department or cost center
Domo’s real-time data refresh means your dashboard reflects current numbers without waiting for overnight batch syncs.
Strengths and trade-offs in practice
The breadth of pre-built connectors and mobile-first design makes Domo accessible across your entire leadership team without requiring IT support for basic access. The primary trade-off is total cost, as Domo sits at the higher end of the market compared to alternatives like Power BI or Qlik.
Pricing and licensing basics
Domo uses custom enterprise pricing based on user count and data volume. Contact Domo directly for a quote, as public list pricing is not available.
Next Steps
Picking the right kpi dashboard software comes down to one question: does it connect directly to the financial data driving your decisions, or does it add another layer your team has to maintain? Each tool on this list has a legitimate use case, but the best starting point is almost always the reporting layer built into the ERP you already run. If your dashboards are disconnected from your ERP data, you will spend more time reconciling numbers than acting on them.
Your ERP implementation shapes what your dashboards can realistically deliver. If your system is not set up to surface the KPIs that matter to your financial goals, no dashboard tool will fix that gap on its own. That is exactly where Concentrus focuses its work. If you want your ERP and your reporting to drive real, measurable outcomes, talk to the Concentrus team about building that foundation the right way.