

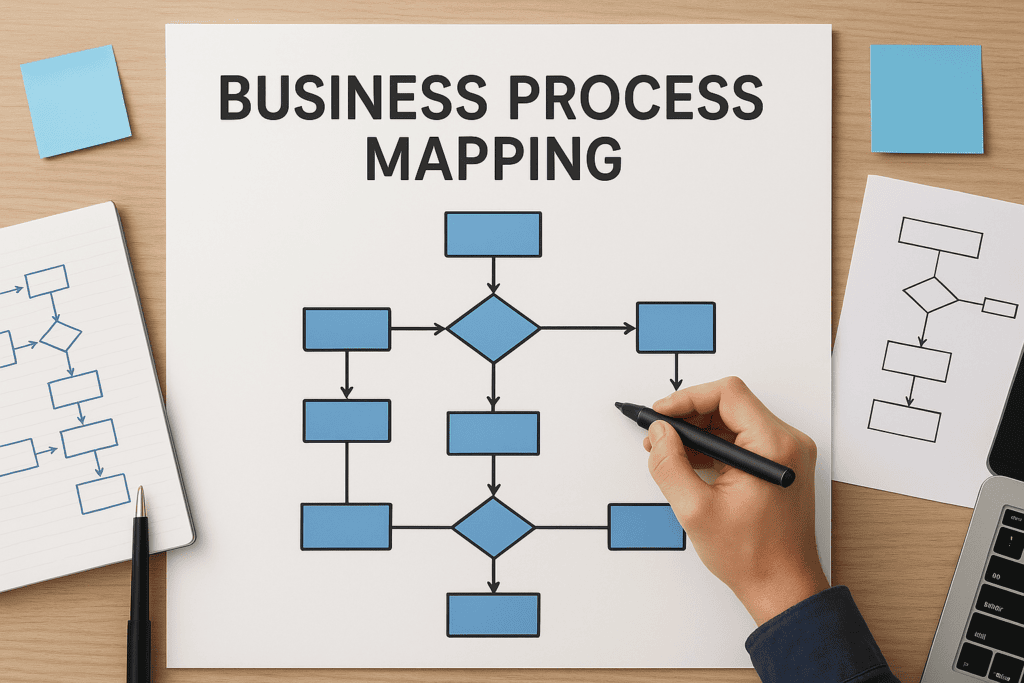
If you searched for a business process mapping definition, you probably just sat through a meeting where three people described the same workflow three different ways. That confusion is expensive, and it’s exactly the problem process mapping fixes. Business process mapping is the practice of documenting, step by step, how work actually moves through your organization, who touches it, what systems it passes through, and where it hands off from one team to the next.
At its core, the purpose is simple: turn tribal knowledge into a visual, shared reference that everyone can point to and agree on. Done well, it exposes redundant approvals, manual data entry, and bottlenecks that quietly drain hours and margin every month, the same issues that surface constantly during ERP implementations and NetSuite or Acumatica rescue projects.
In this article, we’ll walk through a full definition of business process mapping, why finance leaders and operations teams rely on it before touching any technology, and the concrete benefits it delivers once your processes are on paper. You’ll also see how mapping connects directly to ROI, setting the stage for the kind of measurable outcomes that matter most to CFOs evaluating or fixing an ERP investment.
Why business process mapping matters for finance leaders
Finance leaders live and die by numbers, but most ERP failures trace back to something nobody measured: the actual process. Before you can fix a broken close cycle or a bloated procurement chain, you need a clear picture of how the work really flows today, not how the org chart says it should flow. That’s why a solid business process mapping definition always includes the word "actual." Maps built on assumptions instead of observed reality just document the problem more neatly.
The hidden cost of undocumented processes
Undocumented processes hide in plain sight. A controller manually re-keys vendor invoices into three systems because nobody wrote down that the integration never actually worked. A sales rep approves discounts outside policy because the real approval chain lives in someone’s inbox rules, not in any documented workflow. These gaps rarely show up on a P&L line item, but they show up in days sales outstanding, in overtime hours, and in the audit findings nobody wants to explain to the board.
A process you can’t see on paper is a process you can’t fix, price, or scale.
That single line is worth pinning above your desk if you’re a CFO evaluating a new ERP platform or trying to rescue one that’s already gone sideways. You can’t negotiate a realistic implementation timeline, staff a project correctly, or hold a vendor accountable to milestones if nobody in the room agrees on what the current process actually looks like.
Process maps as the foundation before ERP decisions
Before any serious ERP conversation, whether you’re evaluating NetSuite, Acumatica, or trying to salvage a failed rollout, a current-state process map should exist. It’s the single artifact that lets finance, operations, and IT argue from the same facts instead of competing memories. At Concentrus, this is one of the first things we build into every engagement, because the ROI Roadmap™ methodology only works if the starting point is documented accurately. You cannot tie a project to measurable financial outcomes if the baseline itself is guesswork.
Here’s what a documented process typically reveals, based on what we see across manufacturing, distribution, and services clients:
- Duplicate data entry across disconnected systems, often adding 5 to 10 hours per week per employee.
- Manual approval chains that bypass the controls finance thinks are in place.
- Orphaned handoffs between departments where nobody owns the step, so it stalls until someone notices.
- Shadow spreadsheets doing the job an ERP module was supposed to do.
Turning maps into measurable financial outcomes
Finance leaders don’t map processes for the sake of tidy diagrams. They map processes because every box and arrow eventually connects to a dollar figure: faster month-end close, tighter cash conversion cycles, fewer write-offs from missed invoices. According to NIST’s guidance on business process improvement, organizations that formally document workflows before automating them see significantly higher success rates on technology projects, largely because they’ve already removed inefficiencies that would otherwise get baked into the new system.
Skip this step and you risk automating a broken process, which just makes the mess move faster. Map it first, and every ERP decision that follows, module selection, integration scope, staffing, gets grounded in what your business actually needs rather than what a slide deck promised.
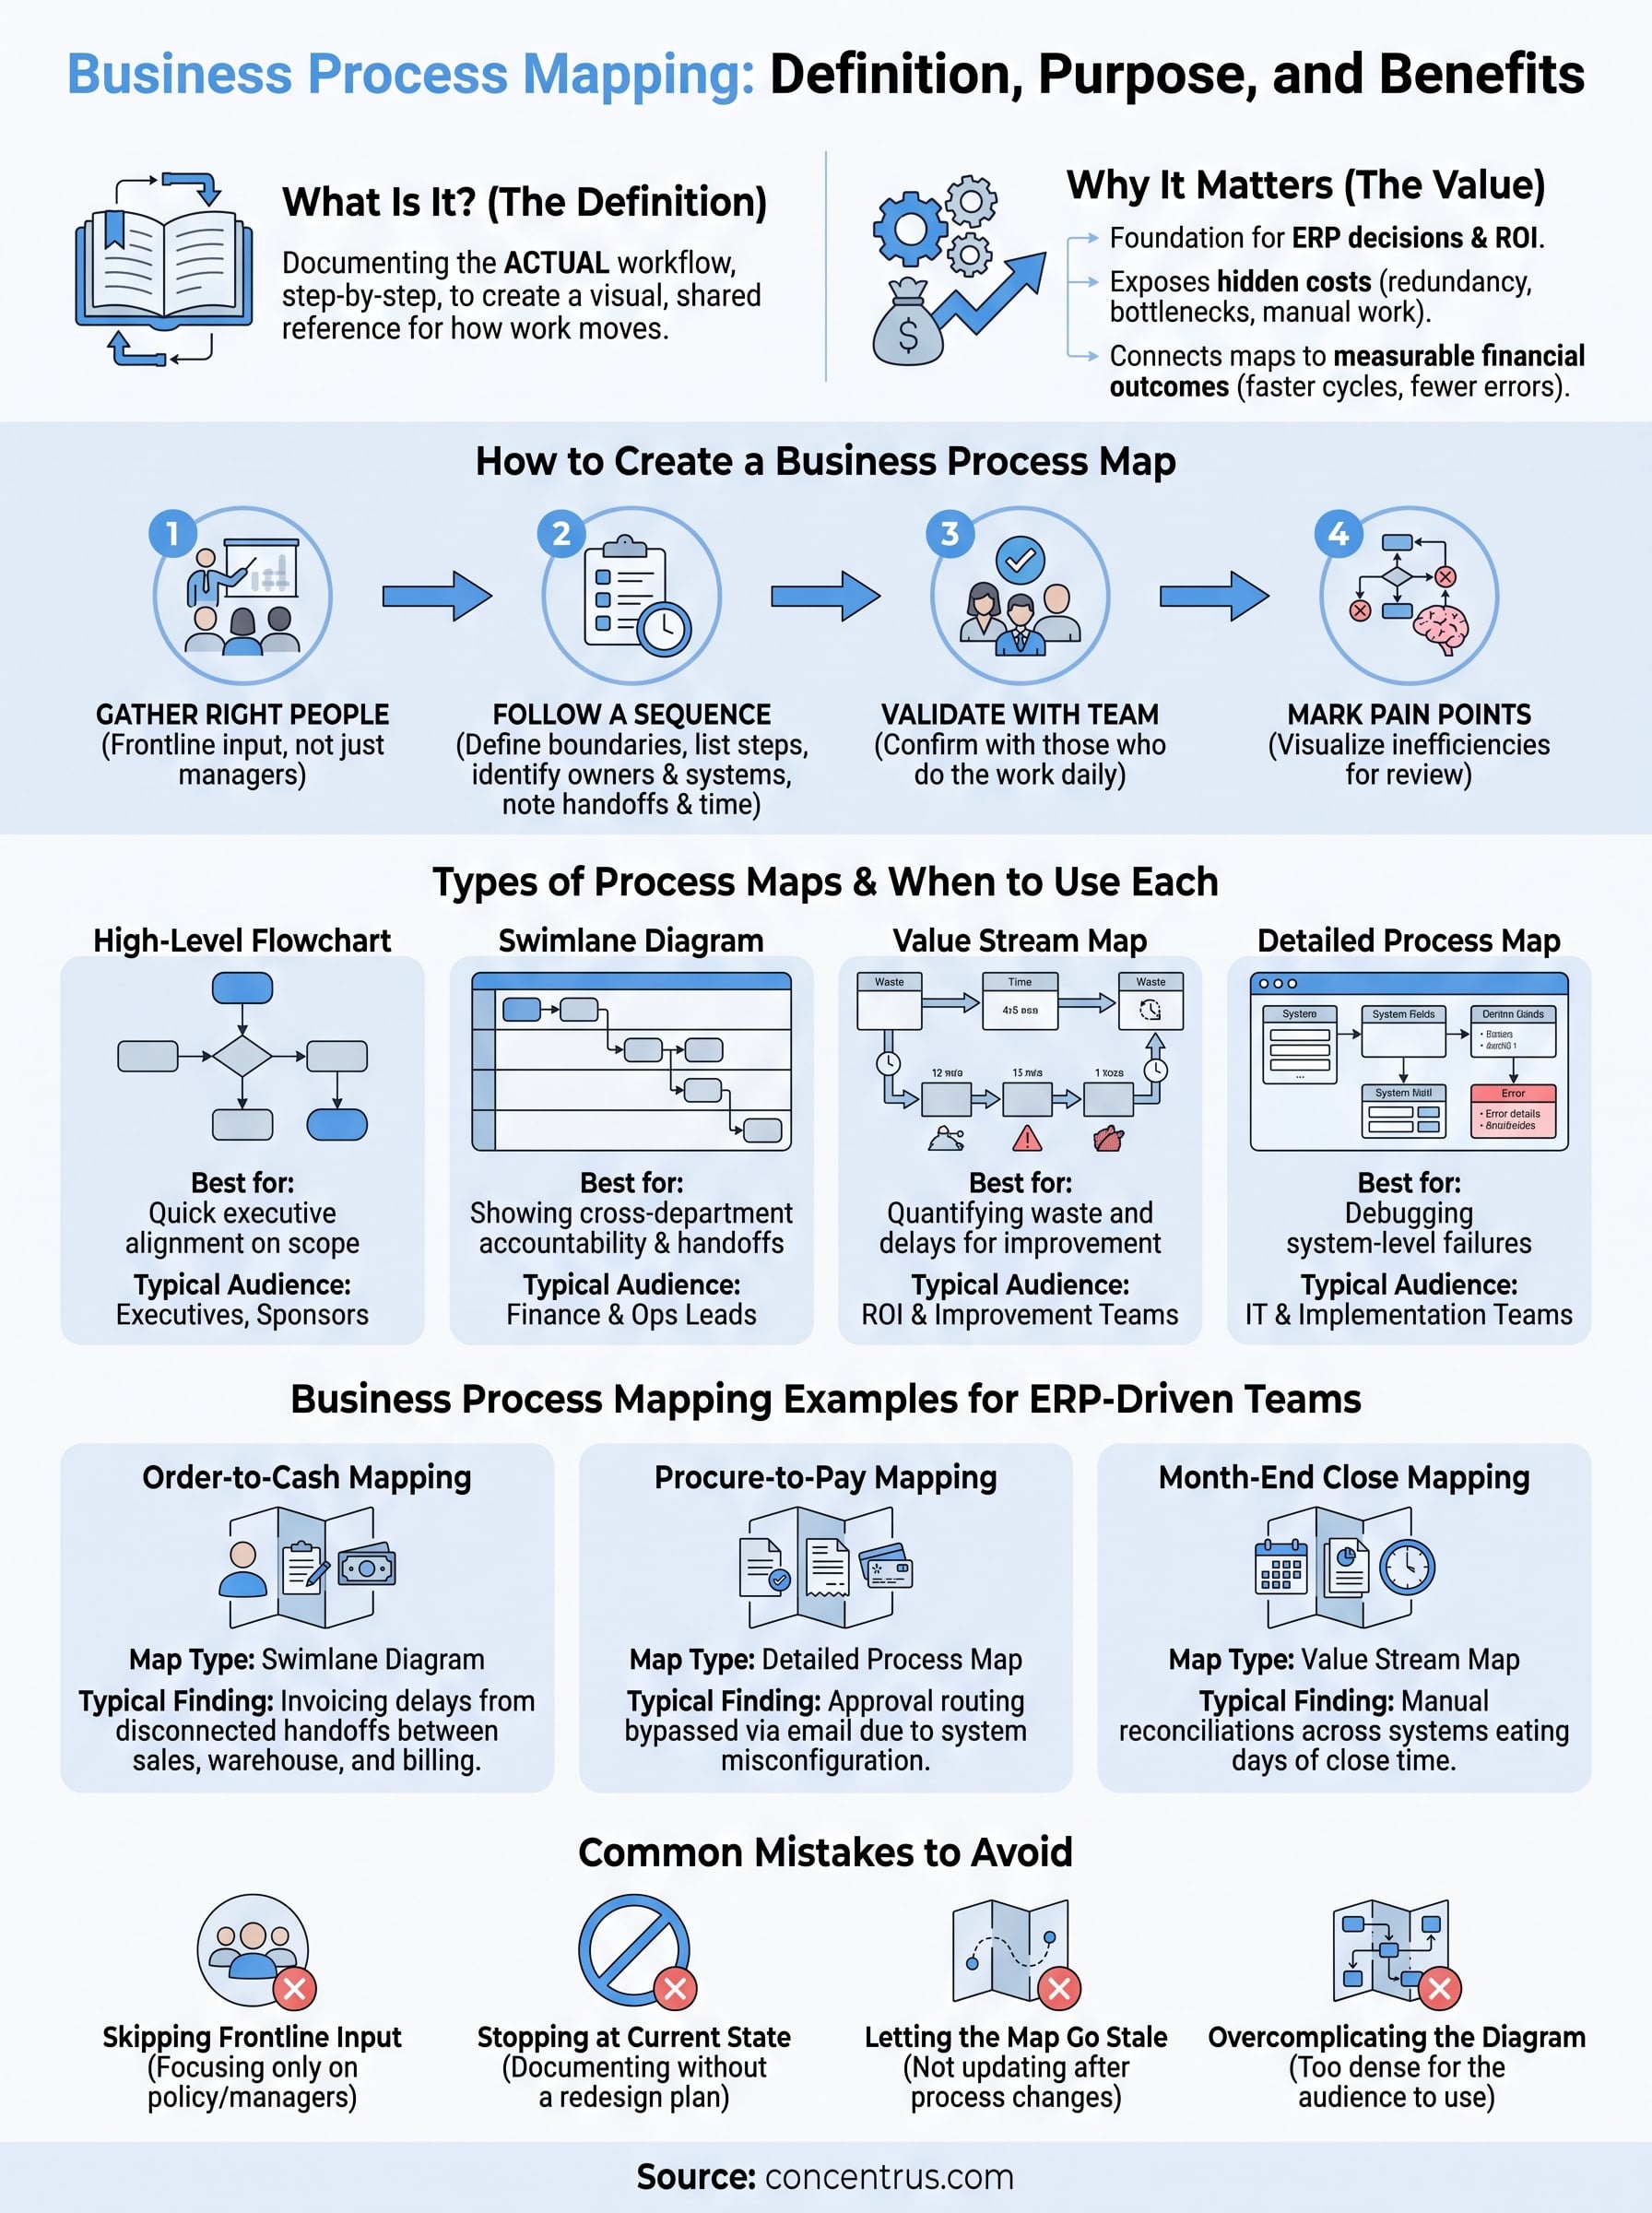
How to create a business process map step by step
Mapping a process isn’t an art project. It’s a disciplined exercise that follows the same sequence whether you’re documenting order-to-cash or a three-way match in accounts payable. Get the sequence right and you end up with a usable diagram; skip steps and you end up with a pretty picture nobody trusts enough to act on.
Gather the right people before you draw anything
Before anyone opens a whiteboard tool, pull together the people who actually perform the work, not just their managers. Managers describe the process as designed; the analyst keying invoices describes the process as lived, and that gap is usually where the ROI hides. Interviews and short observation sessions beat secondhand descriptions every time.
Follow a consistent sequence
Once you have the right voices in the room, work through these steps in order:
- Define the boundaries. Name the exact trigger event and end point, such as "customer PO received" through "invoice paid."
- List every step in sequence, including the ones people are embarrassed to admit, like manual re-entry or email approvals.
- Identify who owns each step and which system, if any, touches it.
- Note the time and handoffs between each step, since delays usually live in the gaps, not the tasks themselves.
- Validate with the team that performs the work daily, before you consider the draft final.
- Mark pain points directly on the map, using color or annotation so they’re impossible to miss in review.
A process map built without the people who do the work is a guess dressed up as documentation.
Choose a format that matches the audience
Finance leaders reviewing a map for ROI decisions need something different than the operations team using it as a daily reference. Swimlane diagrams work well when you need to show accountability across departments, since each lane makes ownership obvious at a glance. Flowcharts work better for simpler, linear processes where sequence matters more than handoffs.
Validate before you rely on it
Validation is the step teams skip most often, and it’s the one that determines whether the map holds up under scrutiny. Walk the finished map past the people interviewed in step one and ask them to challenge it line by line. Errors caught here cost you an hour; errors caught after an ERP configuration is built around a wrong assumption cost weeks and real budget.
Types of process maps and when to use each one
Not every process deserves the same map style. A business process mapping definition that stops at "draw a flowchart" misses the point, because the format you choose determines whether the map actually gets used or just decorates a shared drive. Match the map type to the audience and the decision it needs to support, and you’ll get a document people reference for years instead of one they open once during a kickoff meeting.
High-level flowcharts for quick alignment
High-level flowcharts work when you need executive buy-in fast, before anyone cares about system fields or approval thresholds. They show the major phases of a process, order intake, fulfillment, invoicing, without drowning the reader in every keystroke. Use these in board presentations or early ERP scoping conversations where the goal is agreement on scope, not operational detail.
Swimlane diagrams for cross-department accountability
Swimlane diagrams earn their keep the moment more than one department touches a process. Each horizontal lane represents a role or team, so ownership gaps jump out visually instead of hiding in a paragraph of notes. If your order-to-cash process bounces between sales, finance, and fulfillment, a swimlane map is the only format that shows exactly where the ball gets dropped.
The right map format doesn’t just describe a process, it makes accountability impossible to ignore.
Value stream maps for identifying waste
Value stream maps add a layer flowcharts skip entirely: time and value. They tag every step as value-adding or waste, then quantify the delay between them, which makes them the sharpest tool for spotting where a manual step is costing real hours. Manufacturing and distribution clients lean on these heavily when justifying ERP automation, because the map itself becomes the business case.
Detailed process maps for system-level troubleshooting
Detailed maps go down to field-level actions, error messages, and system triggers. Reserve these for ERP rescue work, where the failure lives in a specific integration step, not the general workflow.
| Map type | Best for | Typical audience |
|---|---|---|
| High-level flowchart | Fast alignment on scope | Executives, project sponsors |
| Swimlane diagram | Cross-department handoffs | Finance and operations leads |
| Value stream map | Quantifying waste and delay | ROI and improvement teams |
| Detailed process map | Debugging system-level failures | IT and implementation teams |
Business process mapping examples for ERP-driven teams
Abstract definitions only get you so far. Seeing how a process map plays out on a real workflow makes the concept click, especially for finance leaders trying to decide where to spend limited mapping hours first. The three examples below show up constantly in NetSuite and Acumatica engagements, and each one maps to a specific financial outcome CFOs care about.

Order-to-cash mapping
Order-to-cash is usually the first process worth mapping, because delays here hit cash flow directly. A swimlane map typically reveals that sales enters an order in one system, fulfillment confirms shipment in a spreadsheet, and finance invoices from a third source that doesn’t reconcile with either. Days sales outstanding climbs not because customers pay slowly, but because the invoice goes out late. Mapping the handoffs between sales, warehouse, and billing exposes exactly where that delay starts.
Procure-to-pay mapping
Procure-to-pay maps often surface the gap between policy and practice. On paper, purchase orders require manager approval above a threshold; in the actual workflow, approvals happen through email because the ERP’s approval routing was never configured correctly. A detailed process map catches this immediately, since it forces someone to trace each approval step back to a system action instead of a policy document. This is one of the most common findings in our ERP Rescue work, where a broken approval chain was quietly draining margin for months before anyone noticed.
The gap between documented policy and actual practice is where most financial leakage hides.
Month-end close mapping
Close cycles are where value stream mapping earns its keep. Tagging each step as value-adding or waste usually shows that half the close consists of manual reconciliations that exist only because two systems don’t talk to each other.
| Process | Common map type used | Typical finding |
|---|---|---|
| Order-to-cash | Swimlane diagram | Invoicing delays from disconnected handoffs |
| Procure-to-pay | Detailed process map | Approval routing bypassed via email |
| Month-end close | Value stream map | Manual reconciliation eating days of close time |
Each of these examples starts the same way: someone finally writes down what’s actually happening, not what the org chart assumes. That single act, more than any software feature, is usually what unlocks the ROI a CFO was hoping the ERP would deliver on its own.
Common mistakes that undermine process mapping efforts
Even experienced teams get a business process mapping effort wrong in predictable ways, and most of the damage happens before the first workshop ends. Knowing these traps ahead of time saves you from redoing the work six months into an ERP rollout, when the cost of a bad map is measured in weeks of rework instead of a few wasted hours.
Skipping the people who do the work
Teams often build maps from policy documents and manager interviews alone, then wonder why the diagram doesn’t match reality on the floor. Frontline input exposes the manual workarounds nobody wants to put in writing, and those workarounds are usually where the real cost hides. A map built exclusively from the top down documents intent, not behavior, and intent doesn’t pay the bills.
Mapping the current state and stopping there
A current-state map that never gets translated into a future-state design just becomes an expensive photograph of dysfunction. Documenting the mess is valuable, but only as a starting point for redesign, not as the finish line. Without a clear next step, the map sits in a shared drive while the same bottlenecks keep draining hours every week.
A map that only describes the problem, without a plan to fix it, is just an expensive complaint.
Letting the map go stale
Processes shift the moment you add a new integration, hire a new approver, or change a vendor, but maps rarely get updated to match. Stale maps create false confidence, since teams keep referencing a diagram that no longer reflects how work actually moves. Treat the map as a living document with an owner responsible for updates, not a one-time deliverable filed away after the kickoff meeting.
Overcomplicating the diagram
Dense maps packed with every possible exception become unreadable, and unreadable maps get ignored. Simplicity matters more than completeness for most audiences, especially executives who need to approve scope, not memorize field-level detail.
- No frontline validation before the map gets finalized
- No future-state redesign following the current-state exercise
- No assigned owner to keep the map current after go-live
- No audience-matched format, leaving executives buried in operational detail they don’t need
Avoid these four mistakes and your map stays a working tool long after the initial mapping exercise ends.
Putting process mapping to work in your organization
A solid business process mapping definition only matters if it changes how your organization actually works. Documenting order-to-cash, procure-to-pay, or your close cycle gives you the baseline every ERP decision should rest on, whether you’re implementing NetSuite for the first time or rescuing a project that’s already stalled. Skip that baseline, and you’re automating guesswork instead of fixing it.
Circle back to the mistakes above before you finalize anything: validate with the people doing the work, redesign the future state, assign an owner, and match the format to your audience. Get those right, and your map becomes a tool finance leaders actually reference, not a diagram filed away after kickoff.
If you’re staring at a process map that exposes more problems than it solves, that’s the right moment to bring in help. Talk to Concentrus about turning that map into a measurable ROI Roadmap™.