
Your inventory represents one of your largest capital investments, yet many midsized companies treat every SKU with equal priority. The result? Cash tied up in slow-moving stock while high-value items face stockouts. ABC analysis for inventory management offers a straightforward fix: categorize your products by their actual financial impact so you can allocate resources where they matter most.
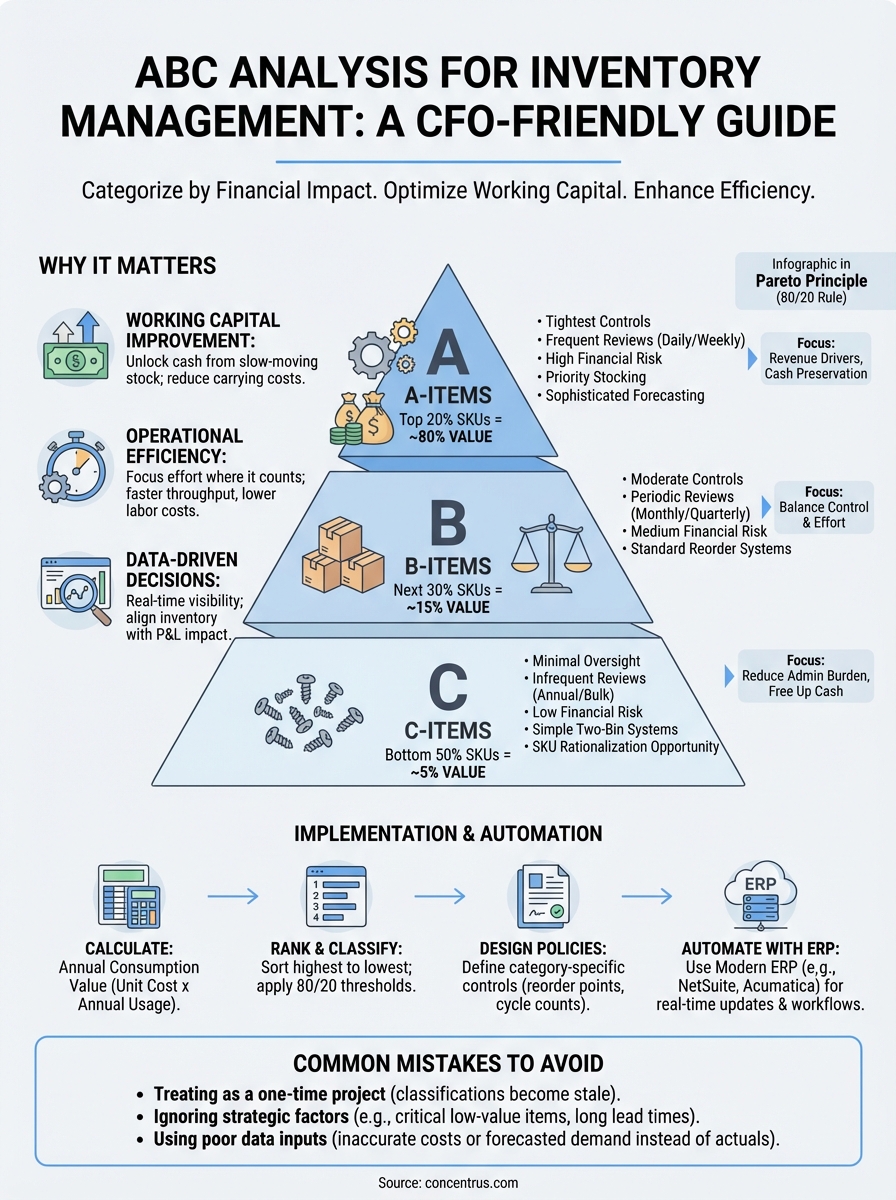
ABC analysis applies the Pareto principle (the 80/20 rule) to your inventory, segmenting items into three tiers based on annual consumption value. A-items typically represent roughly 20% of your SKUs but drive 80% of your revenue. B and C items follow in descending order of importance. This tiered approach gives finance leaders clear visibility into which products deserve tighter controls, more frequent reviews, and priority stocking.
This guide breaks down how ABC analysis works, walks through implementation steps, and shows how modern ERP systems like NetSuite and Acumatica automate the entire process. At Concentrus, we help CFOs build inventory strategies that deliver measurable ROI, and ABC analysis is often a foundational piece of that puzzle.
Why ABC analysis matters to finance and operations
Every CFO knows that excess inventory consumes cash, while stockouts cost you revenue. ABC analysis for inventory management solves this balancing act by directing your attention and resources toward the products that generate the most value. When you classify inventory by financial contribution rather than treating all SKUs identically, you unlock working capital and reduce carrying costs without sacrificing service levels.
Most finance teams discover that their inventory investments follow a predictable pattern: a small percentage of items accounts for the majority of annual dollar movement. Without ABC segmentation, your warehouse teams spend equal effort managing low-value fasteners and high-value finished goods. Your purchasing department applies the same approval thresholds to $50 components and $50,000 assemblies. This one-size-fits-all approach drains resources and obscures the true drivers of profitability.
Cash flow and working capital improvement
ABC analysis identifies which inventory items tie up the most capital so you can optimize stock policies accordingly. Your A-items warrant tight controls and frequent replenishment because they represent significant financial exposure. These products might justify safety stock to prevent costly stockouts, but you track them closely to avoid over-ordering. B and C items receive less intensive management, allowing you to reduce holding costs and free up cash for strategic investments.
You can often cut total inventory value by 15-30% within the first year of implementing ABC controls, according to operational benchmarks. The savings come from reducing surplus C-items (often 50% of your SKU count but only 5% of value) while maintaining service on A-items. This rebalancing directly improves your cash conversion cycle and reduces the working capital drag that limits growth.
When you align inventory investment with actual revenue contribution, you stop funding products that sit on shelves and start deploying capital where it drives returns.
Operational efficiency gains
Your warehouse and procurement teams operate more effectively when they know which items deserve priority. A-items might require daily cycle counts and multiple sourcing options, while C-items can use simpler two-bin replenishment systems. This tiered approach reduces the administrative burden on your operations staff and cuts down on low-value decision-making.
Procurement can negotiate volume discounts and better payment terms for A-items because you understand the financial leverage these products represent. You establish stricter lead time monitoring for critical SKUs and relax controls on items that don’t materially impact your P&L. Your receiving department prioritizes inbound shipments based on ABC classification, ensuring that high-value inventory moves quickly through your facility. The result is faster throughput and lower labor costs per dollar of inventory handled.
Better decision-making with data visibility
ABC analysis transforms inventory from a vague balance sheet number into actionable financial intelligence. You gain clear metrics on which products generate cash and which ones consume it. Your monthly financial reviews can focus on A-item turnover rates, margin trends, and obsolescence risks rather than getting lost in SKU-level noise.
Modern ERP platforms automate ABC calculations and flag when items shift between categories, giving you real-time visibility into changing inventory dynamics. You can track KPIs like A-item stockout frequency, C-item carrying costs, and overall inventory turns by classification. This data supports evidence-based decisions about product discontinuation, supplier consolidation, and warehouse layout optimization. When you tie inventory performance directly to financial outcomes, you create accountability across operations and prove ROI on process improvements.
How ABC analysis works using the 80-20 rule
ABC analysis for inventory management divides your stock into three categories based on annual consumption value, which you calculate by multiplying the unit cost of each item by its annual usage volume. This creates a clear hierarchy that mirrors the Pareto principle: a small percentage of your SKUs generates the majority of your inventory investment and revenue impact. You rank all items from highest to lowest value, then draw boundaries that separate A, B, and C classes.

The standard breakdown assigns your top 20% of SKUs by value to the A category, the next 30% to B, and the remaining 50% to C. These percentages are guidelines rather than fixed rules. What matters most is that A-items account for roughly 70-80% of your total annual inventory value, B-items represent 15-20%, and C-items make up the final 5-10%. Your actual thresholds will depend on your specific product mix and business model.
The three inventory categories and their thresholds
A-items represent your highest-value products that require the tightest controls and most frequent attention. These SKUs justify sophisticated forecasting methods, multiple supplier relationships, and daily monitoring. You typically maintain moderate safety stock on A-items to prevent stockouts, but you review reorder points monthly because small errors in planning translate to significant financial impact. Your finance team should track A-item turnover rates and obsolescence risk as part of standard operating reviews.
B-items fall into the middle tier where you balance control effort with financial exposure. These products warrant periodic reviews (usually quarterly) and standard reorder systems rather than the intensive management you apply to A-items. You might consolidate B-item purchasing into monthly cycles instead of continuous replenishment. The goal is to maintain adequate service levels without dedicating disproportionate resources to items that don’t drive the bulk of your revenue.
C-items comprise the largest number of SKUs but represent minimal financial risk. You can manage these products with simple two-bin systems or annual bulk orders that minimize administrative overhead. Many companies discover they can reduce C-item variety by 30-50% through SKU rationalization without affecting operations. Your warehouse team spends less time cycle counting these items, and your procurement department uses higher approval thresholds or automated reordering.
When you align management intensity with financial impact, you stop wasting resources on products that don’t move the needle and focus your team on inventory that drives profitability.
How the Pareto principle applies to inventory value
The 80/20 rule surfaces repeatedly in inventory data across industries. Your top 100 SKUs might generate 80% of revenue while your bottom 2,000 SKUs account for just 5%. This pattern holds whether you manufacture industrial equipment or distribute consumer goods. ABC classification makes this distribution visible and actionable so you can design inventory policies that match each tier’s actual financial contribution. You stop treating a $5,000 assembly the same way you manage a $10 component.
How to calculate ABC classes with real inventory data
You calculate ABC classes by ranking every SKU in your inventory based on annual consumption value, then drawing boundaries that separate high-impact items from the rest. The math is straightforward: multiply each item’s unit cost by its annual usage quantity to get its total value contribution. Once you have this number for every product, you sort the list from highest to lowest and calculate cumulative percentages. This process reveals which products deserve A-level controls and which ones can operate with minimal oversight.
Step-by-step calculation process
Start by pulling a complete inventory report from your ERP system that includes SKU number, unit cost, and annual usage quantity for each item. Calculate the annual consumption value by multiplying unit cost times annual usage. For example, if you use 500 units of a component priced at $120, the annual value is $60,000. Repeat this calculation across all SKUs and sum the total to get your baseline.
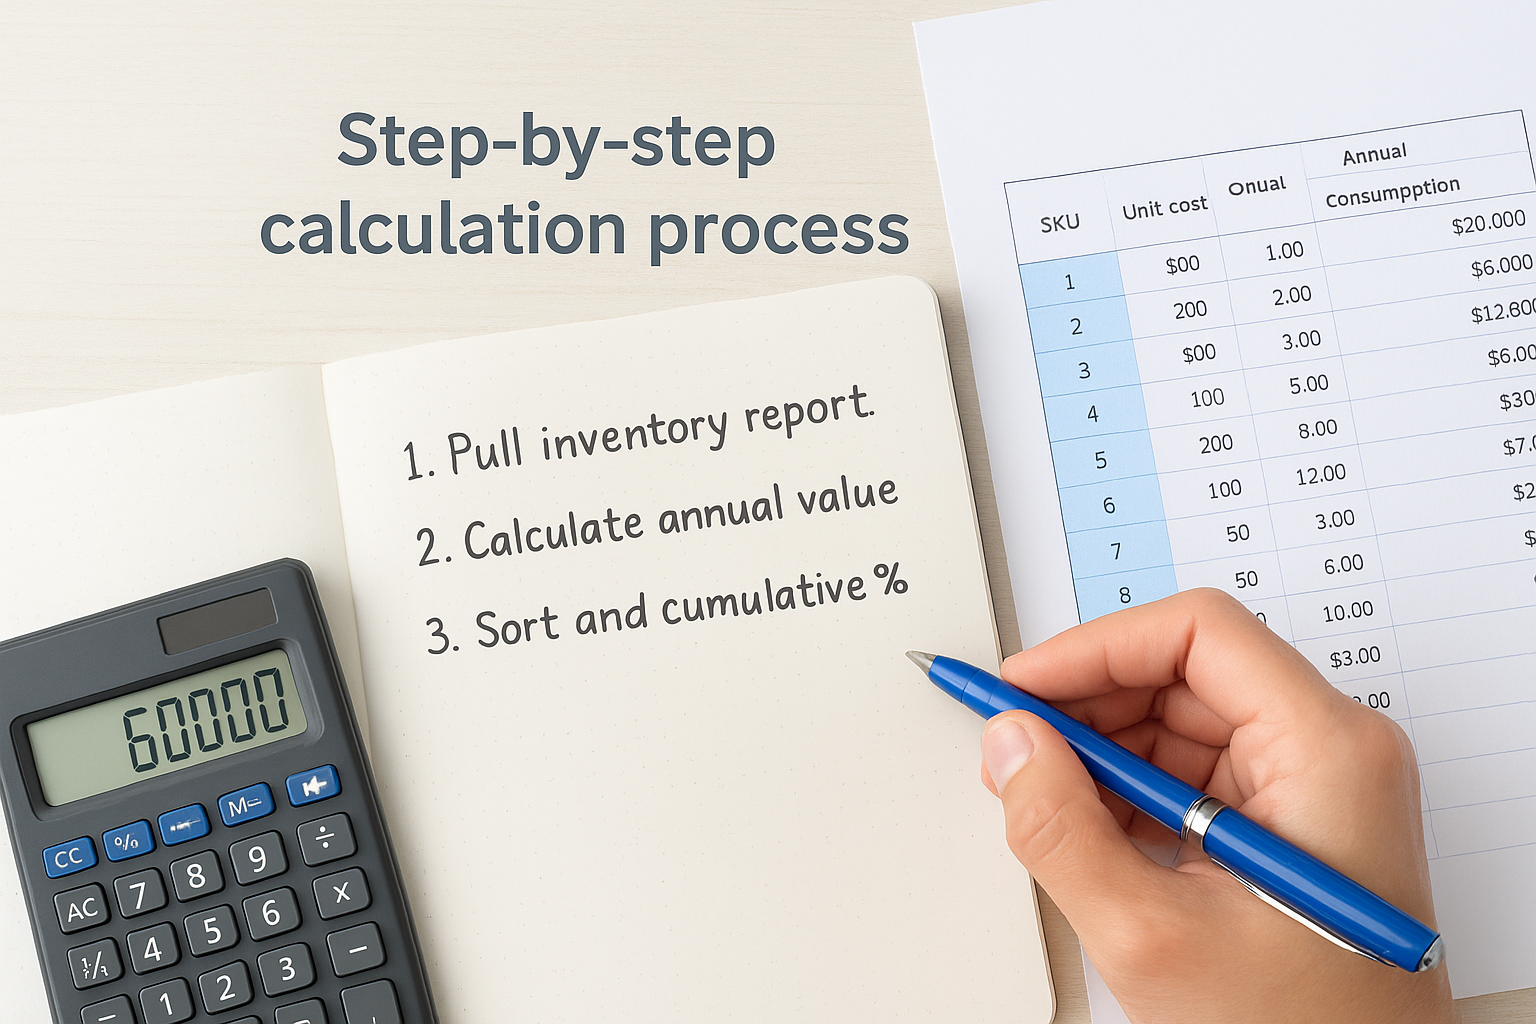
Sort your inventory list from highest to lowest annual consumption value. Add a column that shows the cumulative percentage of total value as you move down the list. Your top SKU might represent 12% of total inventory value. The second item adds another 8%, bringing your cumulative total to 20%. Continue this process until you reach 100%.
Draw classification boundaries based on cumulative value thresholds. Items that comprise the first 70-80% of cumulative value become your A category. The next tier that takes you to 90-95% becomes B. Everything else falls into C. You might discover that your first 150 SKUs (A-items) account for 75% of annual value, the next 300 (B-items) add 20%, and your remaining 1,200 (C-items) contribute just 5%.
When you rank items by actual financial impact rather than intuition, you often discover that products you thought were critical account for less than 1% of inventory value.
Setting your classification thresholds
You adjust ABC boundaries based on your operational priorities and resource constraints rather than rigid formulas. Some companies set A-item thresholds at 80% cumulative value to keep the category small and manageable. Others use 70% to capture more items that warrant enhanced controls. The right threshold depends on how much management capacity your team has and how sensitive your operations are to stockouts.
Review your initial classifications for practical exceptions. A low-value component that causes production line shutdowns if missing might deserve A-level treatment despite its modest annual consumption value. Custom items with long lead times or single-source dependencies often warrant promotion to a higher category. You use ABC analysis for inventory management as a starting framework, then overlay business-critical factors that pure math might miss.
How to implement ABC inventory controls that stick
Implementation success depends on translating your ABC classifications into specific operating procedures that your teams can execute consistently. You need clear policies for each category, automation that enforces those policies, and metrics that prove the system delivers value. Most ABC initiatives fail not because of poor classification but because companies stop at the analysis phase without building actionable controls into daily workflows.
Design category-specific policies for each tier
Your A-items require tight reorder point management and frequent review cycles to prevent both stockouts and excess inventory. Set maximum and minimum stock levels based on lead times and demand variability, then establish daily or weekly replenishment triggers. You might implement demand-driven planning for A-items while B-items operate on monthly review cycles. Define specific approval thresholds that escalate high-value purchase orders to senior leadership while allowing automated reordering for C-items below a certain dollar amount.
Create differentiated service level targets that reflect each category’s financial impact. Your A-items might target 98% availability because stockouts directly hit revenue, while C-items can operate at 85% without material business consequences. Document cycle counting frequencies that match risk levels: daily or weekly counts for A-items, monthly for B-items, and quarterly or annual for C-items. This tiered approach concentrates your quality control effort where financial exposure is highest.
Build controls into your ERP system
Configure your NetSuite or Acumatica system to automate ABC classifications and trigger category-specific workflows. Set up item records with ABC fields that update automatically based on consumption value calculations. Your ERP can flag when an item crosses classification thresholds so you adjust management policies accordingly. Build approval routing rules that send A-item purchase requisitions through finance review while auto-approving C-item orders under preset limits.
When you embed ABC logic directly into your ERP workflows, you eliminate manual enforcement and ensure every transaction follows the appropriate control level.
Train teams and track compliance
Your warehouse, procurement, and planning teams need clear guidance on how ABC analysis for inventory management changes their daily responsibilities. Conduct training sessions that explain why A-items warrant different handling and what specific behaviors you expect for each category. Assign accountability metrics like A-item stockout frequency or C-item carrying cost reduction to relevant department heads. Review ABC performance quarterly to identify drift and reinforce compliance. You measure success through working capital improvement, not just classification accuracy.
Common ABC analysis mistakes and how to fix them
Most companies stumble during ABC implementation not because the methodology is complex but because they treat classification as a one-time project rather than an ongoing discipline. You analyze your inventory, assign categories, then move on to other priorities while product lifecycles shift and demand patterns change. Your A-items from last year might no longer drive the same revenue, but your policies remain frozen in place. These implementation gaps prevent you from capturing the full ROI that ABC analysis for inventory management should deliver.
Treating ABC classifications as permanent
Your inventory mix evolves constantly as products mature, customer preferences shift, and new items enter your catalog. When you set ABC categories once and forget about them, you continue managing yesterday’s high-value items with intensive controls while ignoring emerging revenue drivers. Your ERP system should recalculate classifications at least quarterly based on rolling 12-month consumption data. Set up automated alerts when items cross classification thresholds so you can adjust policies immediately.
When classifications become stale, you waste management capacity on products that no longer matter while critical items slip through the cracks.
Ignoring strategic and operational factors
Pure mathematical ranking captures financial value but misses products that deserve elevated treatment for business-critical reasons. A low-value component that halts production if missing warrants A-level controls despite modest annual consumption value. Long lead time items, single-source products, and customer-specific SKUs often require tighter management than their dollar contribution suggests. You layer qualitative criteria onto your value-based classifications to create a practical system that reflects real operational risks. Document these exceptions clearly so your team understands why certain items receive special handling.
Using poor data inputs
Your ABC classifications are only as reliable as the cost and usage data that feed them. Many companies pull unit costs from purchase orders without accounting for freight, duties, or handling expenses, which understates true inventory investment. Others use forecasted demand instead of actual consumption history, creating classifications based on optimistic projections rather than reality. Clean your data before running ABC calculations by validating unit costs against your general ledger and using trailing 12-month actual usage. Update your analysis when you identify data quality issues rather than waiting for the next scheduled review cycle.
What to do next
ABC analysis for inventory management delivers measurable results when you build it into your daily operations rather than treating it as a one-time exercise. Start by calculating your current classifications using trailing 12-month data from your ERP system, then establish category-specific policies for reordering, cycle counting, and approval thresholds. You should see initial working capital improvements within the first quarter as you reduce C-item surplus and tighten A-item controls.
Your ERP platform plays a central role in sustaining ABC discipline over time. If you’re implementing NetSuite or Acumatica, or if your current system isn’t delivering the inventory visibility you need, Concentrus helps CFOs build ERP solutions that tie directly to financial outcomes. We design inventory controls that free up cash, improve turns, and create the real-time reporting you need to scale with confidence.