CFOs track dozens of financial metrics, but few carry as much weight as cash flow. When comparing free cash flow vs operating cash flow, the distinction matters more than most finance teams realize. One tells you how much cash your operations generate. The other tells you how much of that cash is actually available to reinvest, pay down debt, or return to shareholders. Confusing the two, or relying on the wrong one, can lead to flawed forecasts and poor capital allocation decisions.
Both metrics start from the same foundation, but they answer fundamentally different questions about your company’s financial position. Operating cash flow measures the cash your core business produces, stripped of accounting adjustments like depreciation. Free cash flow takes that number a step further by subtracting capital expenditures, the money you spend to maintain or grow your asset base. That gap between the two reveals whether your business is generating surplus cash or quietly burning through it.
This article breaks down how each metric works, the formulas behind them, and when to use one over the other. At Concentrus, we help midsized companies build ERP systems around measurable financial outcomes, and accurate cash flow reporting sits at the center of that work. Whether you’re running NetSuite or Acumatica, having clean, real-time visibility into both OCF and FCF is what turns your ERP from a record-keeping tool into a decision-making engine.
Why cash flow metrics matter to CFOs
Most financial reports center on profit, but profit and cash are not the same thing. A company can post strong earnings while running short on actual liquidity due to timing differences between revenue recognition and cash collection. For CFOs at midsized companies, that gap is where real financial risk hides, and it’s precisely why cash flow metrics belong at the top of any serious performance dashboard. Understanding which metric to use and when separates reactive financial management from confident, forward-looking strategy.
The limits of profit-based metrics
Net income and EBITDA tell you what your business earned, but they don’t tell you what your business can spend. Accrual accounting allows revenue to be recorded before cash arrives and expenses to be deferred, which means your income statement can look healthy while your bank account tells a different story. Working capital shifts, customer payment delays, and inventory build-ups all absorb cash that never shows up as a loss on your P&L. Without cash flow metrics layered alongside profit figures, you’re only seeing part of the picture.
Relying on net income alone to assess financial health gives you a picture of what you’ve earned, not what you actually control.
Cash flow as a decision-making tool
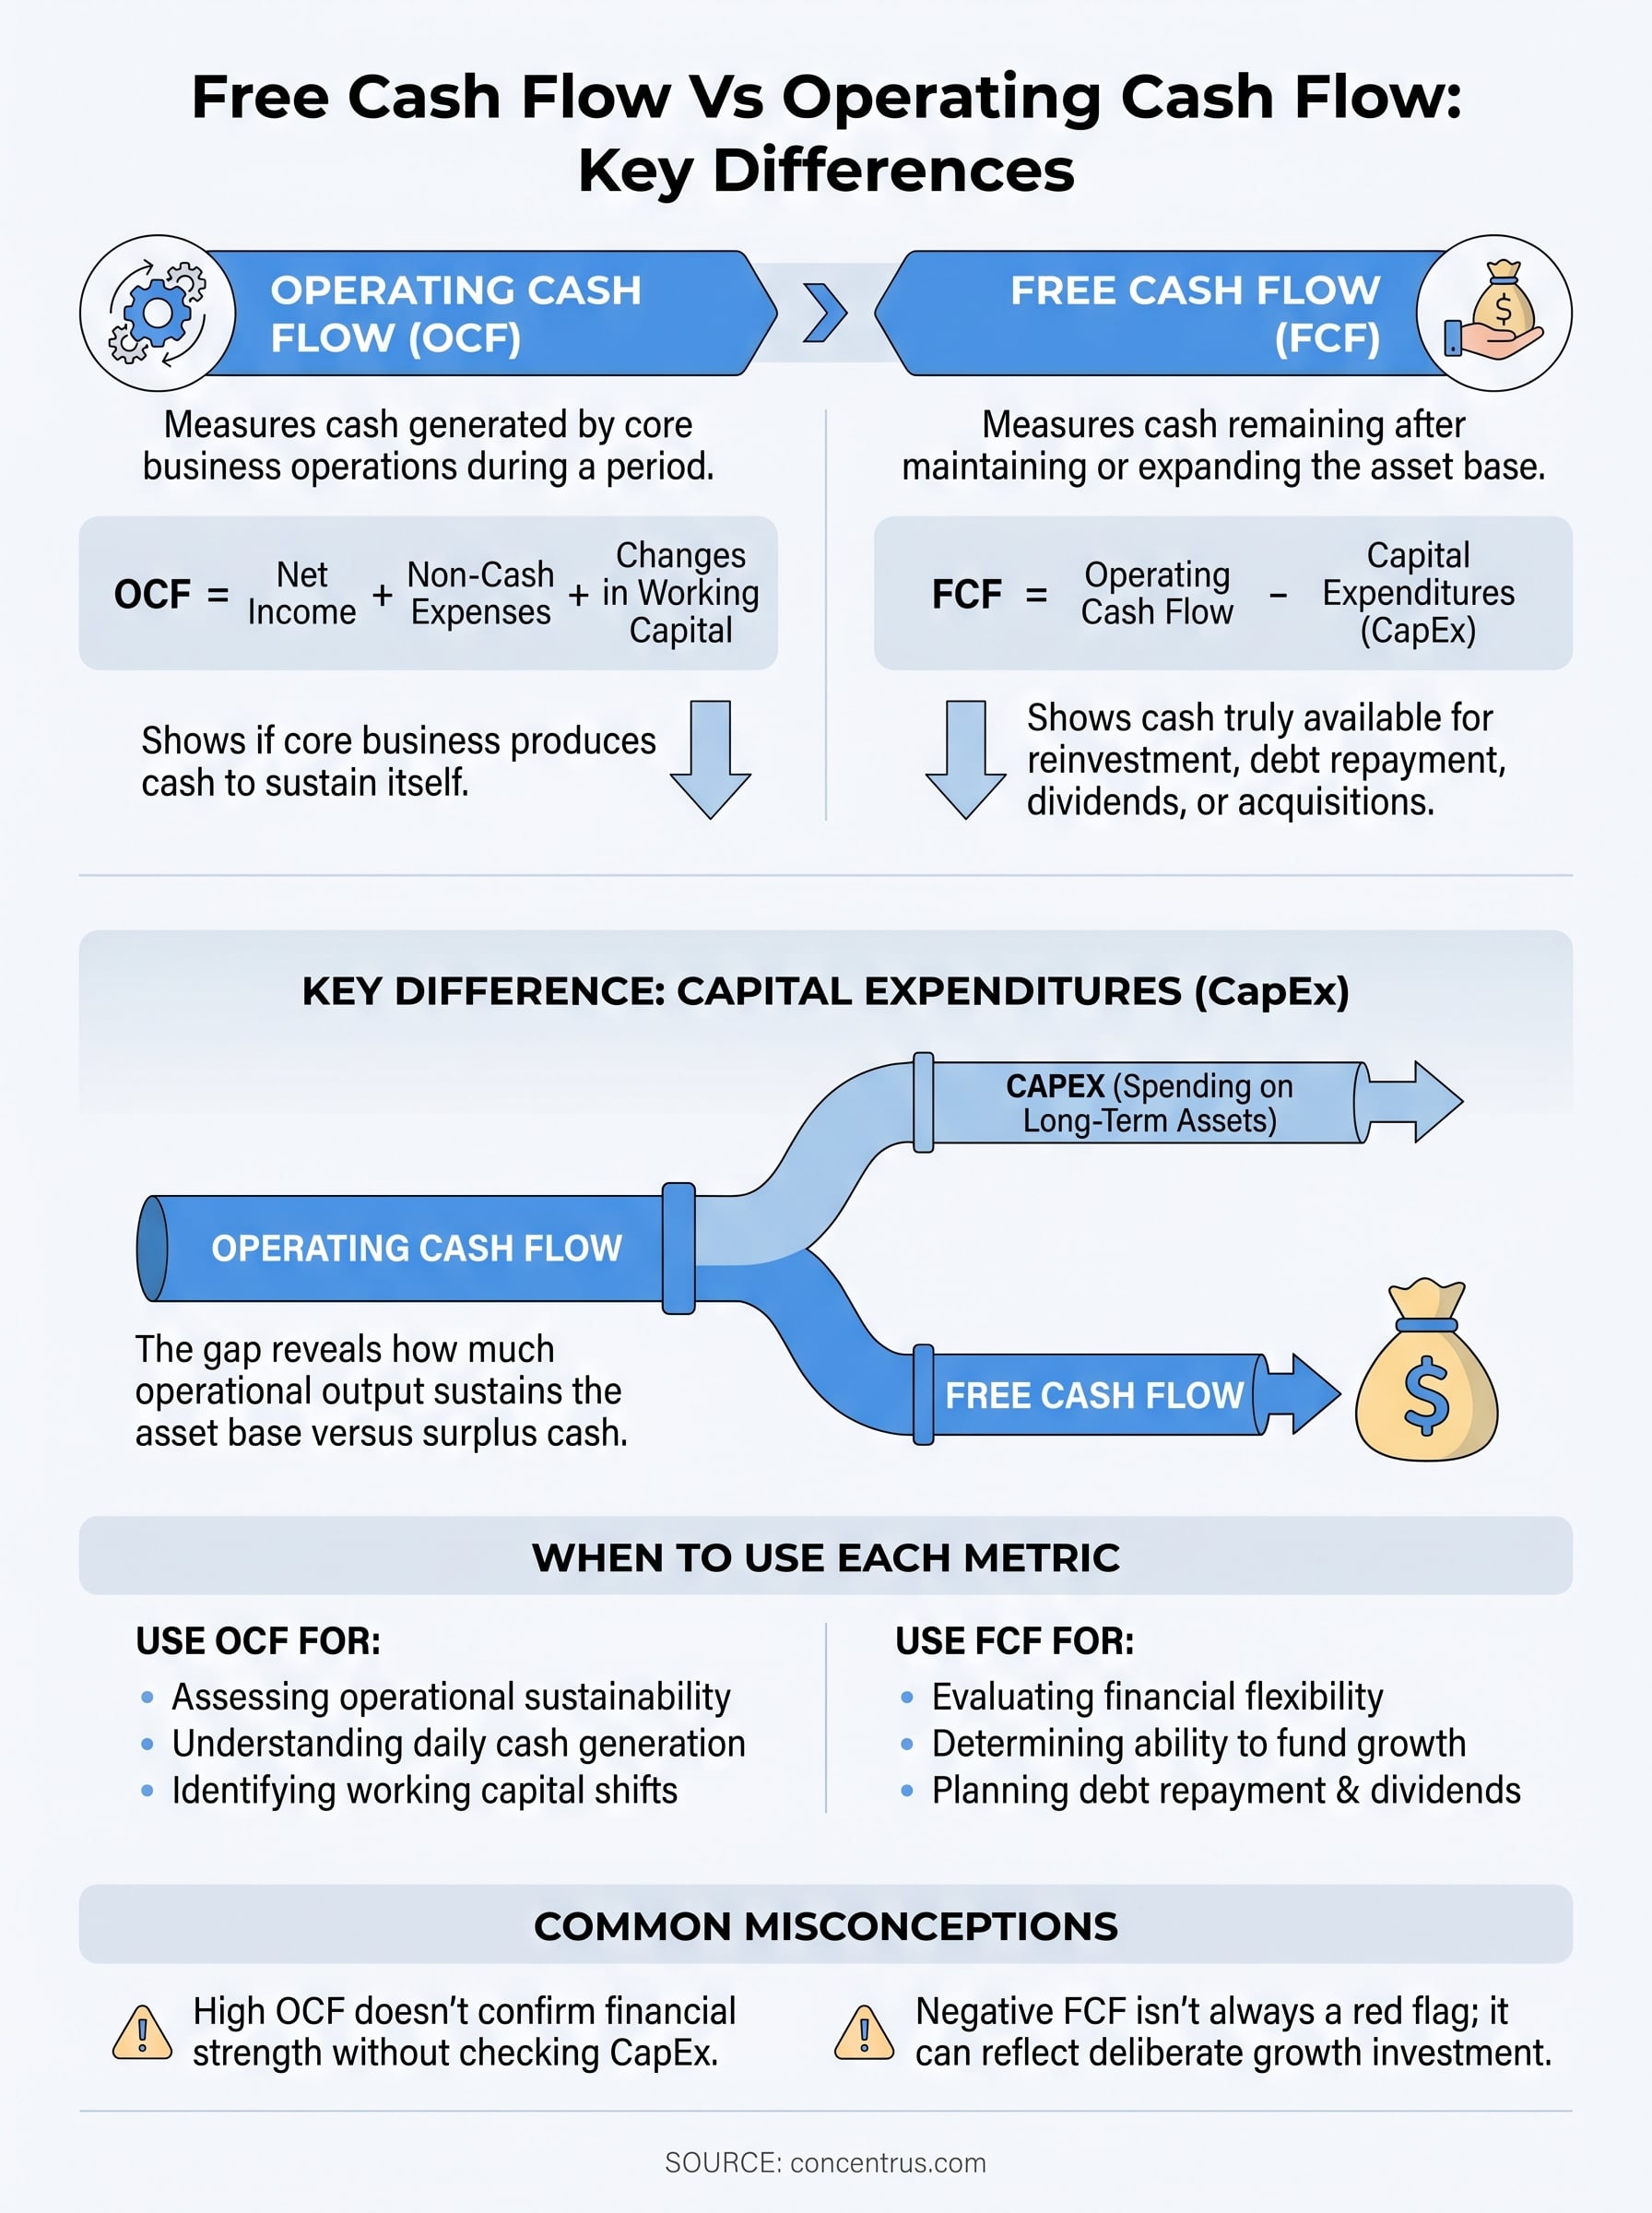
This is where understanding free cash flow vs operating cash flow becomes critical for CFOs making capital allocation decisions. Operating cash flow shows you whether your core business generates enough cash to sustain itself day to day. Free cash flow goes further by subtracting capital expenditures, leaving you with the cash truly available for debt repayment, acquisitions, dividends, or reinvestment. Together, these two numbers give you a complete picture of financial capacity that profit metrics simply cannot provide.
Your ability to plan headcount, negotiate financing, or approve major purchases depends on knowing how much cash your business actually produces after maintaining its asset base. Finance leaders who rely on static spreadsheets or delayed reports make decisions based on yesterday’s data. Real-time cash flow visibility through a well-configured ERP lets you respond to shifts in receivables, payables, and capital spending as they happen, not after the quarter closes.
What operating cash flow tells you
Operating cash flow (OCF) measures the cash your business generates from its core operations during a given period. It starts with net income and adjusts for non-cash items like depreciation and amortization, then accounts for changes in working capital, including shifts in receivables, payables, and inventory. The result tells you whether your business model actually produces cash or simply records accounting profit.
The OCF formula
Calculating OCF gives you a direct view of operational sustainability without the noise of financing or investing activities. The standard indirect method formula looks like this:
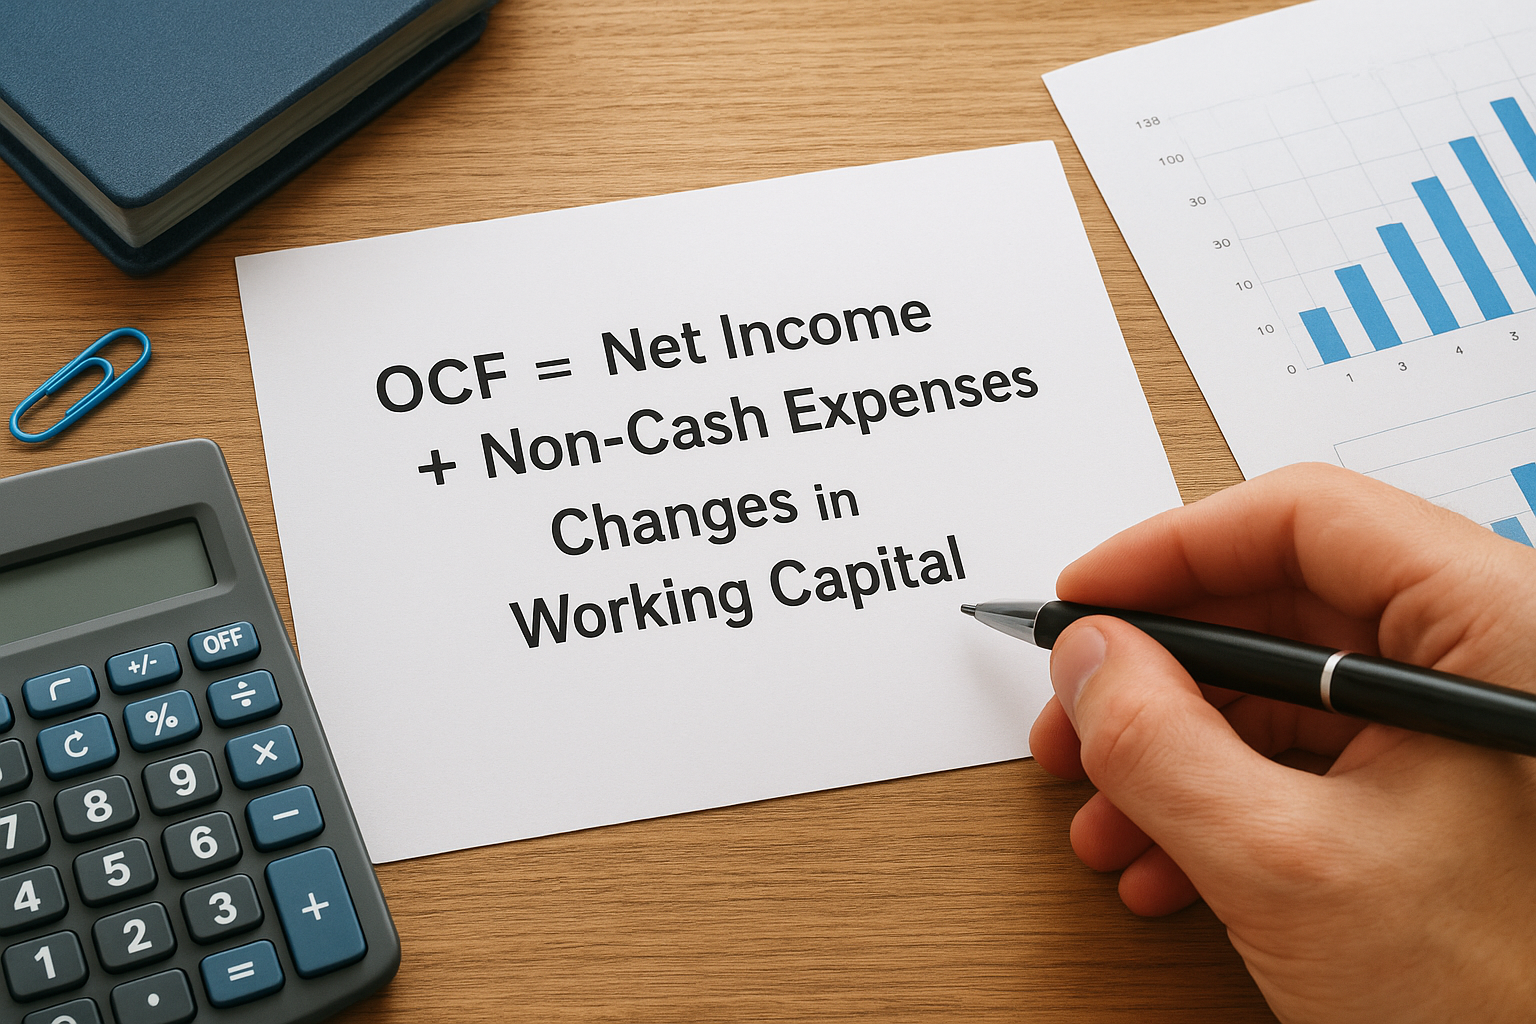
OCF = Net Income + Non-Cash Expenses + Changes in Working Capital
Each component matters. Non-cash expenses like depreciation get added back because they reduce net income without reducing actual cash. Working capital changes adjust for the timing gap between when you earn revenue and when you collect it, which is where many midsized companies discover hidden cash flow problems.
What OCF signals about your business health
A consistently positive OCF confirms that your operations fund themselves without relying on external financing or asset sales. When comparing free cash flow vs operating cash flow, OCF is the starting point because it isolates business performance from capital spending decisions.
If your OCF is declining while net income holds steady, your working capital is absorbing cash that your income statement isn’t capturing.
Negative OCF over multiple periods is a serious warning sign, even if your company is profitable, because it signals that operations are consuming rather than generating liquidity.
What free cash flow tells you
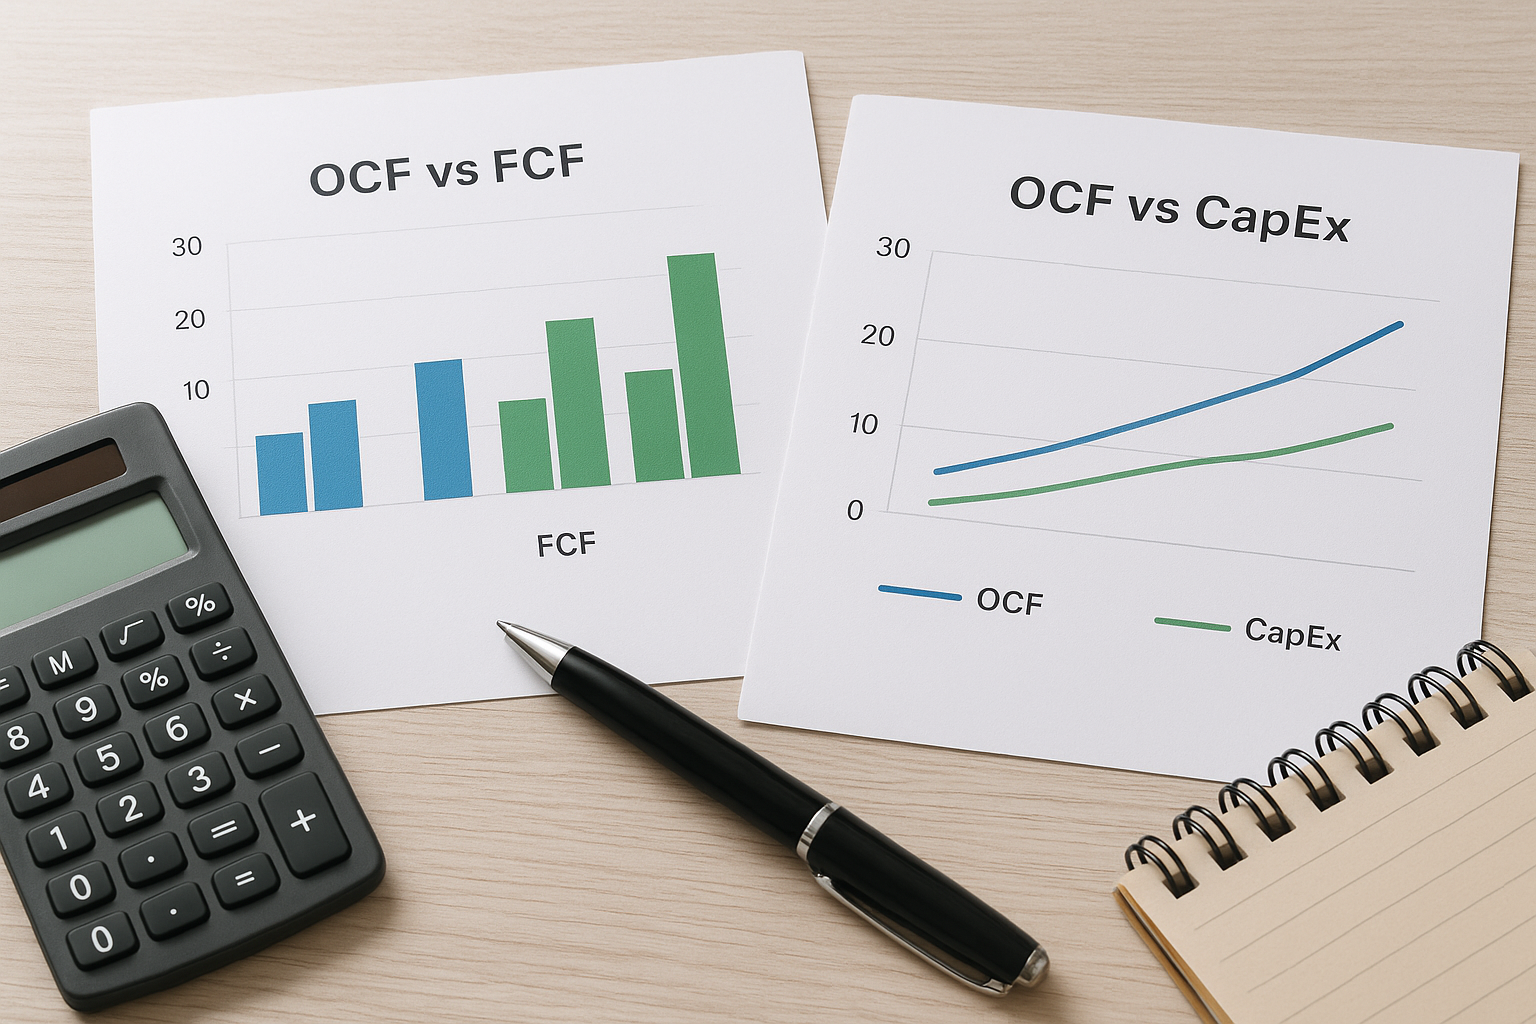
Free cash flow (FCF) builds directly on operating cash flow by subtracting capital expenditures (CapEx), the money your business spends on property, equipment, and other long-term assets. Where OCF tells you how much cash your operations generate, FCF tells you how much of that cash remains after you’ve paid to maintain or expand your physical capacity. That distinction is what makes FCF the more complete picture when evaluating true financial flexibility.
The FCF formula
FCF is calculated from OCF using one straightforward subtraction:
FCF = Operating Cash Flow – Capital Expenditures
CapEx figures come directly from your cash flow statement under investing activities. The simplicity of this formula is deliberate. By removing only capital spending, FCF keeps your focus on the cash your business controls after fulfilling its obligations to sustain operations.
What FCF reveals that OCF cannot
When comparing free cash flow vs operating cash flow, FCF answers a question OCF leaves open: after you’ve invested in your asset base, how much cash can you actually deploy? A business with strong OCF but heavy CapEx requirements may have far less financial flexibility than its operating performance suggests.
FCF is the number investors, lenders, and boards use to assess whether a business can fund growth without relying on outside capital.
Sustained positive FCF signals that your business generates real surplus cash. Negative FCF is not always a red flag, since high-growth companies often invest aggressively, but it demands explanation and a clear plan tied to specific return milestones.
Key differences and common misconceptions
When finance teams debate free cash flow vs operating cash flow, the confusion usually comes down to scope. OCF measures what your operations produce. FCF measures what you keep after funding your physical infrastructure. Both numbers pull from the same cash flow statement, but they answer different questions, and using one when you need the other leads to flawed analysis and poor decisions.
Where the two metrics diverge
The single structural difference between OCF and FCF is capital expenditures. OCF stops before CapEx, which means it reflects your operational engine without accounting for the cost of maintaining or expanding it. FCF includes that deduction, making it a more conservative and complete measure of deployable cash. A capital-intensive business like a manufacturer can show strong OCF while generating minimal FCF, simply because equipment investment consumes most of what operations produce.
The gap between OCF and FCF is not a flaw in either metric. It tells you exactly how much of your operational output goes toward sustaining your asset base.
Misconceptions that distort financial decisions
One common mistake is treating high OCF as confirmation of financial strength without checking what CapEx is absorbing. Another is assuming negative FCF signals failure, when it often reflects deliberate investment in growth capacity. You need both figures in context. A third misconception is that FCF and net income move together. They often diverge sharply, especially when depreciation schedules, working capital shifts, or large asset purchases create timing gaps that accounting profit does not capture.
How to calculate and use FCF from OCF
Turning OCF into FCF is straightforward, but the real value comes from how you apply both numbers inside your planning process. When examining free cash flow vs operating cash flow, the calculation itself takes seconds. What separates strong finance teams is whether they use both figures consistently to drive decisions rather than pulling them only for investor presentations.
Step-by-step calculation
Start by pulling operating cash flow directly from your cash flow statement under operating activities. Then locate capital expenditures in the investing activities section, typically labeled as “purchases of property, plant, and equipment.” Subtract CapEx from OCF, and you have your FCF. Here is the structure in practice:
- Identify OCF from your cash flow statement
- Locate CapEx under investing activities
- Apply: FCF = OCF – CapEx
- Track the result against prior periods and your budget
Running this calculation monthly rather than quarterly gives you earlier visibility into whether capital spending is outpacing operational cash generation.
Putting the numbers to work
Once you have both figures, compare them over rolling periods to spot trends that single-quarter snapshots miss. A widening gap between OCF and FCF often signals rising maintenance requirements or aggressive expansion spending that needs a return timeline attached to it.
Schedule a recurring FCF review inside your close cycle rather than saving it for board reporting. Comparing actual FCF against budgeted CapEx each month keeps capital spending decisions anchored to real cash performance, not projections built six months earlier.
Next steps for cleaner cash reporting
Understanding free cash flow vs operating cash flow gives you a stronger foundation for every capital allocation decision your team makes. But knowing the formulas is only part of the work. The other part is making sure your reporting infrastructure delivers accurate, real-time cash flow data without requiring your team to stitch together spreadsheets at the end of every period.
Your ERP system should pull OCF and FCF figures automatically as part of your close cycle. If your current setup requires manual adjustments to produce clean cash flow statements, that’s a configuration problem worth fixing before it distorts a major financial decision. Reliable cash reporting starts with a properly built ERP, and that’s exactly where Concentrus focuses. If your system isn’t giving you the visibility you need, talk to an ERP and ROI expert at Concentrus to see what a better-configured setup can deliver for your finance team.